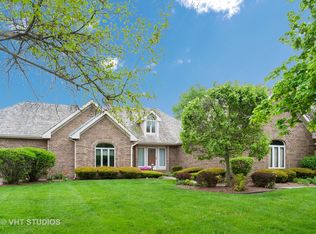
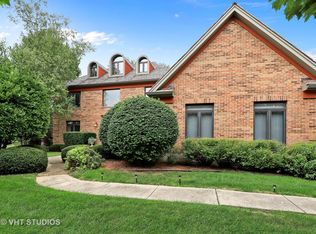
$707,400
4 bd|5 ba|3.3k sqft
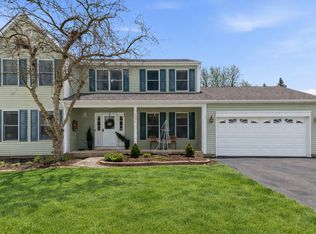
17820 W Pond Ridge Cir, Gurnee, IL 60031
Off Market
Likely to sell faster than
Zillow last checked: 7 hours ago
Listing updated: February 22, 2026 at 07:35pm
Corey Barker 224-548-1323,
Keller Williams North Shore West
Not available
Estimated sales range
Not available
Not available
| Date | Event | Price |
|---|---|---|
| 2/23/2026 | Contingent | $600,000$155/sqft |
Source: | ||
| 2/13/2026 | Listed for sale | $600,000+51.9%$155/sqft |
Source: | ||
| 12/9/2013 | Sold | $395,000+5.4%$102/sqft |
Source: | ||
| 11/1/2013 | Pending sale | $374,900$97/sqft |
Source: Red Zone Realty Group,Inc #08465862 Report a problem | ||
| 10/12/2013 | Listed for sale | $374,900-1.9%$97/sqft |
Source: Red Zone Realty Group,Inc #08465862 Report a problem | ||
| 8/25/2012 | Listing removed | $382,000$99/sqft |
Source: RE/MAX Center #07547826 Report a problem | ||
| 12/16/2011 | Listed for sale | $382,000-11.2%$99/sqft |
Source: RE/MAX Center #07547826 Report a problem | ||
| 1/5/2011 | Listing removed | $430,000$111/sqft |
Source: RE/MAX Center #07547826 Report a problem | ||
| 12/23/2010 | Price change | $430,000-4.4%$111/sqft |
Source: RE/MAX Center #07547826 Report a problem | ||
| 6/9/2010 | Listed for sale | $450,000-10%$116/sqft |
Source: RE/MAX Center #07547826 Report a problem | ||
| 8/2/2004 | Sold | $500,000+19%$129/sqft |
Source: Public Record Report a problem | ||
| 9/7/2000 | Sold | $420,000$109/sqft |
Source: Public Record Report a problem | ||
| Year | Property taxes | Tax assessment |
|---|---|---|
| 2023 | $14,642 -5.6% | $186,770 +12% |
| 2022 | $15,516 +10.2% | $166,732 +2.6% |
| 2021 | $14,083 +3.9% | $162,566 +6.8% |
| 2020 | $13,561 +1.9% | $152,207 +3% |
| 2019 | $13,305 +0.8% | $147,788 -1.6% |
| 2018 | $13,200 | $150,203 +2.9% |
| 2017 | $13,200 +3.8% | $145,899 +4.7% |
| 2016 | $12,712 +7.4% | $139,403 +5.4% |
| 2015 | $11,832 -6% | $132,211 +5.9% |
| 2014 | $12,591 +19% | $124,843 -0.8% |
| 2012 | $10,581 +21.5% | $125,799 -19.3% |
| 2011 | $8,707 -15.1% | $155,819 -9% |
| 2010 | $10,255 +8.8% | $171,263 -7.1% |
| 2009 | $9,427 -22.4% | $184,345 -1.2% |
| 2008 | $12,148 +14.1% | $186,546 +16% |
| 2006 | $10,647 +0.2% | $160,811 |
| 2005 | $10,621 +1.2% | -- |
| 2004 | $10,497 +3.7% | -- |
| 2003 | $10,123 +4.9% | -- |
| 2002 | $9,653 +4.2% | -- |
| 2001 | $9,265 +2.9% | $128,699 +3.5% |
| 2000 | $9,004 | $124,356 |
Find assessor info on the county website
Source: MRED as distributed by MLS GRID. This data may not be complete. We recommend contacting the local school district to confirm school assignments for this home.