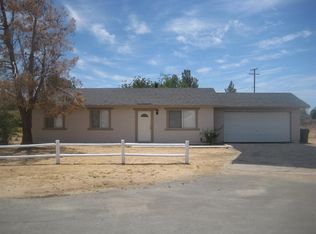
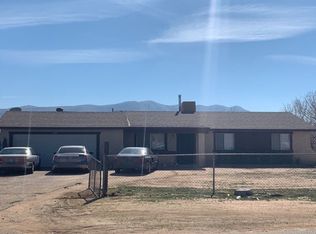
Nice Home with 3 bdr, 2 Baths, Living Room with Fireplace, Dining Area off Kitchen, Slider to covered Patio and rear fenced yard, Fenced front yard with Beautiful Big Shade Tree. Convenient location - close to schools and shopping. Had a house fire in 2015 so everything is updated, energy efficient l,and up to code as of 2016.
Pre-foreclosure
Street View
Est. $404,700
21124 Del Oro Rd, Apple Valley, CA 92308
3beds
1,257sqft
SingleFamily
Built in 1987
0.41 Acres Lot
$404,700 Zestimate®
$322/sqft
$-- HOA
Overview
- 219 days |
- 15 |
- 0 |
Facts & features
Interior
Bedrooms & bathrooms
- Bedrooms: 3
- Bathrooms: 2
- Full bathrooms: 2
Heating
- Forced air, Other, Gas, Wood / Pellet
Cooling
- Central
Appliances
- Included: Dishwasher, Garbage disposal, Microwave, Range / Oven
Features
- Flooring: Tile, Carpet
- Basement: None
- Has fireplace: Yes
Interior area
- Total interior livable area: 1,257 sqft
Property
Parking
- Total spaces: 2
- Parking features: Garage - Attached
Features
- Exterior features: Stucco
- Has view: Yes
- View description: Territorial
Lot
- Size: 0.41 Acres
Details
- Parcel number: 0434331090000
Construction
Type & style
- Home type: SingleFamily
Materials
- wood frame
- Roof: Shake / Shingle
Condition
- Year built: 1987
Community & HOA
Location
- Region: Apple Valley
Financial & listing details
- Price per square foot: $322/sqft
- Tax assessed value: $376,728
- Annual tax amount: $5,216
Visit our professional directory to find a foreclosure specialist in your area that can help with your home search.
Find a foreclosure agentForeclosure details
Estimated market value
$404,700
$384,000 - $425,000
$2,141/mo
Price history
Price history
| Date | Event | Price |
|---|---|---|
| 2/28/2022 | Sold | $355,000+1.5%$282/sqft |
Source: Public Record Report a problem | ||
| 2/2/2022 | Pending sale | $349,900$278/sqft |
Source: | ||
| 1/26/2022 | Listed for sale | $349,900$278/sqft |
Source: | ||
| 1/20/2022 | Pending sale | $349,900$278/sqft |
Source: | ||
| 1/20/2022 | Listed for sale | $349,900$278/sqft |
Source: | ||
| 1/18/2022 | Pending sale | $349,900$278/sqft |
Source: | ||
| 1/13/2022 | Listed for sale | $349,900$278/sqft |
Source: | ||
| 12/24/2021 | Pending sale | $349,900$278/sqft |
Source: | ||
| 11/4/2021 | Listed for sale | $349,900+366.5%$278/sqft |
Source: | ||
| 3/30/2012 | Sold | $75,000$60/sqft |
Source: Public Record Report a problem | ||
| 12/9/2011 | Listed for sale | $75,000+8.7%$60/sqft |
Source: Agio Real Estate Inc. AV #410677 Report a problem | ||
| 9/18/2011 | Listing removed | $69,000$55/sqft |
Source: Agio Real Estate Inc. AV #407170 Report a problem | ||
| 8/28/2011 | Listed for sale | $69,000+11.3%$55/sqft |
Source: Agio Real Estate Inc. AV #407170 Report a problem | ||
| 8/21/1998 | Sold | $62,000-35.3%$49/sqft |
Source: Public Record Report a problem | ||
| 12/18/1996 | Sold | $95,901$76/sqft |
Source: Public Record Report a problem | ||
Public tax history
Public tax history
| Year | Property taxes | Tax assessment |
|---|---|---|
| 2025 | $5,216 -2.5% | $376,728 +2% |
| 2024 | $5,347 -6.3% | $369,342 +2% |
| 2023 | $5,709 +396.6% | $362,100 +307.9% |
| 2022 | $1,150 +2.3% | $88,772 +2% |
| 2021 | $1,124 +1.3% | $87,032 +1% |
| 2020 | $1,110 +1.9% | $86,140 +2% |
| 2019 | $1,089 +2.5% | $84,451 +2% |
| 2018 | $1,063 +1.4% | $82,795 +2% |
| 2017 | $1,048 | $81,171 +2% |
| 2016 | $1,048 +7.8% | $79,579 +1.5% |
| 2015 | $972 +1.5% | $78,383 +2% |
| 2014 | $957 | $76,847 +0.5% |
| 2013 | -- | $76,500 -0.7% |
| 2012 | -- | $77,072 +2% |
| 2011 | -- | $75,561 +0.8% |
| 2010 | -- | $74,996 -0.2% |
| 2009 | -- | $75,174 +2% |
| 2008 | -- | $73,700 +2% |
| 2007 | -- | $72,255 +2% |
| 2006 | -- | $70,839 +2% |
| 2005 | -- | $69,450 +2% |
| 2004 | -- | $68,088 +1.9% |
| 2003 | -- | $66,840 +2% |
| 2002 | -- | $65,529 +2% |
| 2001 | -- | $64,245 +2% |
| 2000 | -- | $62,985 |
Find assessor info on the county website
BuyAbility℠ payment
Estimated monthly payment
All calculations are estimates and provided by Zillow, Inc. for informational purposes only. Actual amounts may vary.
HOA fees may include property taxes on listings classified as Co-Ops. Contact the listing agent and/or owner for fee details.
Mortgage interest rates are dependent on a number of factors, including credit score, down payment, and repayment length. Interest rate data provided by Zillow Group Marketplace, Inc. as of 1/1/1970 from various mortgage lenders with which we have lead or other similar arrangements; the Estimated Payment is an average of those rates.
See how much you could borrow to make a competitive offer.
Boost your down payment with 6% savings match
Earn up to a 6% match & get a competitive APY with a *. Zillow has partnered with to help get you home faster.
Learn more*Terms apply. Match provided by Foyer. Account offered by Pacific West Bank, Member FDIC.Climate risks
Neighborhood: 92308
Nearby schools
GreatSchools rating
- 3/10Sandia Elementary SchoolGrades: K-8Distance: 0.4 mi
- 5/10Apple Valley High SchoolGrades: 9-12Distance: 1 mi
- California
- San Bernardino County
- Apple Valley
- 92308
- 21124 Del Oro Rd
Nearby cities
Nearby zip codes
Other Apple Valley Topics
