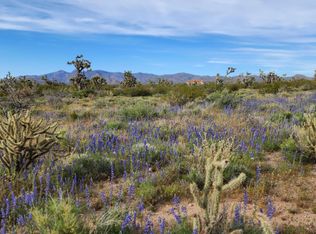
Handyman special, this property is a fixer upper and could be the perfect off-grid RV/off-road property.
Closed
$36,000
21188 S Cheyenne Road, Yucca, AZ 86438
4beds
1,732sqft
Single Family Residence
Built in 2000
40.07 Acres Lot
$-- Zestimate®
$21/sqft
$1,350 Estimated rent
Home value
Not available
Estimated sales range
Not available
$1,350/mo
Zestimate® history
Owner options
List your home for rent
$1,350/mo
Rent Zestimate®
Find your next renter with Zillow Rental Manager. Plus, with online applications, you can quickly screen prospective tenants – for free.
$1,350/mo
Rent Zestimate®
Refinance and save
$365/mo
Est. payment
Refinancing to a lower rate could help reduce your monthly payments and save thousands over the life of the loan.
$365/mo
Est. payment
Explore your selling options
Work with a Zillow partner agent
Leverage their expertise and Zillow's premium Showcase listings to get your home seen by more buyers.
Get startedList with your own agent
Get your home in front of millions of buyers by listing it on Zillow.
Learn how to do itSell it yourself
Take full control of how buyers see your home on Zillow by listing For Sale by Owner (FSBO).
List your homeWhat's special
Zillow last checked:
Listing updated:
Listed by:
Terry Silk 928-846-2390,
Homesmart River Realty
Bought with:
Non Member, NA
Non-Member
Source: Momentum MLS,MLS#: 032993 Originating MLS: Western AZ Regional Real Estate Data Exchange
Facts & features
Interior
Bedrooms & bathrooms
- Bedrooms: 4
- Bathrooms: 1
- Full bathrooms: 1
Heating
- None
Cooling
- None
Appliances
- Included: Dryer, Gas Dryer, Gas Oven, Gas Range, Water Heater
Features
- None
Interior area
- Total structure area: 1,732
- Total interior livable area: 1,732 sqft
Property
Features
- Entry location: None
- Pool features: None
- Fencing: None
Lot
- Size: 40.07 Acres
- Dimensions: 1320' x 1321'
Details
- Parcel number: 12121011
- Zoning description: R1 Single-Family Residential
Construction
Type & style
- Home type: SingleFamily
- Property subtype: Single Family Residence
Materials
- Roof: Rolled/Hot Mop
Condition
- New construction: No
- Year built: 2000
Utilities & green energy
- Sewer: Septic Tank
Community & HOA
Community
- Subdivision: Stage Coach Trails
HOA
- Has HOA: Yes
- HOA fee: $200 annually
- HOA name: Santa Fe Ranch
Location
- Region: Yucca
Financial & listing details
- Price per square foot: $21/sqft
- Tax assessed value: $232,227
- Annual tax amount: $845
- Date on market: 10/1/2025
- Cumulative days on market: 218 days
- Date available: 10/31/2025
Price history
| Date | Event | Price |
|---|---|---|
| 6/19/2026 | Sold | $36,000-28%$21/sqft |
Source: | ||
| 6/5/2026 | Pending sale | $49,999$29/sqft |
Source: | ||
| 6/1/2026 | Listed for sale | $49,999$29/sqft |
Source: | ||
| 5/3/2026 | Pending sale | $49,999$29/sqft |
Source: | ||
| 2/2/2026 | Price change | $49,999-9.1%$29/sqft |
Source: | ||
| 1/16/2026 | Price change | $55,000-8.3%$32/sqft |
Source: | ||
| 12/12/2025 | Price change | $60,000-7.7%$35/sqft |
Source: | ||
| 11/19/2025 | Price change | $65,000-7.1%$38/sqft |
Source: | ||
| 10/1/2025 | Listed for sale | $70,000+366.7%$40/sqft |
Source: | ||
| 1/27/2015 | Sold | $15,000$9/sqft |
Source: Public Record Report a problem | ||
Public tax history
| Year | Property taxes | Tax assessment |
|---|---|---|
| 2026 | $922 +9.1% | $23,223 +4.2% |
| 2025 | $845 -9.4% | $22,293 -7.5% |
| 2024 | $934 +18.9% | $24,101 +35.7% |
| 2023 | $785 -8.4% | $17,764 -29.6% |
| 2022 | $857 +7% | $25,247 +21.2% |
| 2021 | $800 +7.5% | $20,832 +8.2% |
| 2019 | $745 | $19,251 +55.9% |
| 2018 | $745 +9.3% | $12,346 +36.4% |
| 2017 | $681 -2.2% | $9,052 +10% |
| 2016 | $696 -28% | $8,230 -28.6% |
| 2015 | $967 | $11,528 +3.8% |
| 2014 | -- | $11,110 +5% |
| 2013 | -- | $10,585 +4.7% |
| 2012 | -- | $10,111 -15% |
| 2011 | -- | $11,889 -34% |
| 2009 | -- | $18,017 +49.3% |
| 2008 | -- | $12,070 |
| 2007 | -- | -- |
| 2006 | -- | -- |
| 2005 | -- | -- |
| 2004 | -- | -- |
Find assessor info on the county website
Neighborhood: 86438
Nearby homes
- $65,00030 Acres2076 S Cheyenne Rd, Yucca, AZ 86438Sold
- $706,9733 bd3 ba3k sqft21038 S Cheyenne Rd, Yucca, AZ 86438Off Market

- $18,87640.04 Acres21191 S Cheyenne Rd, Yucca, AZ 86438Off Market
- $30,00040 Acres261 S Wagon Trail Rd, Yucca, AZ 86438Sold

- $30,00040 Acres257 S Wagon Trail Rd, Yucca, AZ 86438Sold
- $--38 Acres2068 Cheyenne Ave #2068, Yucca, AZ 86438Off Market
- $30,00040.01 Acres21222 S Wagon Trail Rd, Yucca, AZ 86438Sold
- $30,00040 Acres258 S Wagon Trail Rd, Yucca, AZ 86438Sold
Nearby schools
GreatSchools rating
- NAYucca Elementary SchoolGrades: PK-8Distance: 24.3 mi
- Arizona
- Mohave County
- Yucca
- 86438
- 21188 S Cheyenne Road
Nearby cities
Nearby zip codes
Other Yucca Topics
