Come check out this adorable home located in Epperly Heights addition. This home would be great for a 1st time home buyer or an investor looking to add to their portfolio. Book your showing today! This property is being sold AS IS condition. This is a short sale property- All offers go through the bank for approval.
For sale
$125,000
4001 SE 22nd St, Del City, OK 73115
3beds
1,249sqft
Single Family Residence
Built in 1951
6,499 Square Feet Lot
$119,600 Zestimate®
$100/sqft
$-- HOA
What's special
- 521 days
- 244
- 13
Zillow last checked:
Listing updated:
Listed by:
Aimee Bocock 405-403-1002,
Whittington Realty
Source: MLSOK/OKCMAR as distributed by MLS GRID,MLS#: 1176357
Facts & features
Interior
Bedrooms & bathrooms
- Bedrooms: 3
- Bathrooms: 1
- Full bathrooms: 1
Heating
- Central
Cooling
- Has cooling: Yes
Features
- Has fireplace: No
- Fireplace features: None
Interior area
- Total structure area: 1,249
- Total interior livable area: 1,249 sqft
Property
Features
- Levels: One
- Stories: 1
- Exterior features: None
Lot
- Size: 6,499 Square Feet
- Features: Other
Details
- Parcel number: 4001SE22nd73115
- Special conditions: Lender Approval /ShortSale
Construction
Type & style
- Home type: SingleFamily
- Architectural style: Traditional
- Property subtype: Single Family Residence
Materials
- Brick
- Foundation: Slab
- Roof: Composition
Condition
- Year built: 1951
Community & HOA
Location
- Region: Del City
Financial & listing details
- Price per square foot: $100/sqft
- Tax assessed value: $137,756
- Annual tax amount: $1,691
- Date on market: 6/18/2025
- Listing terms: As is Condition,Cash,Conventional,Sell FHA or VA
Estimated market value
$119,600
$114,000 - $126,000
$1,119/mo
Price history
| Date | Event | Price |
|---|---|---|
| 1/15/2026 | Listed for sale | $125,000-7.4%$100/sqft |
Source:  MLSOK/OKCMAR as distributed by MLS GRID #1176357 Report a problem | ||
| 6/18/2025 | Listed for sale | $135,000+12.5%$108/sqft |
Source: MLSOK/OKCMAR as distributed by MLS GRID #1176357 Report a problem | ||
| 6/16/2025 | Listing removed | $120,000$96/sqft |
Source: MLSOK/OKCMAR as distributed by MLS GRID #1132362 Report a problem | ||
| 6/16/2025 | Listed for sale | $120,000$96/sqft |
Source: MLSOK/OKCMAR as distributed by MLS GRID #1132362 Report a problem | ||
| 3/7/2025 | Pending sale | $120,000$96/sqft |
Source: MLSOK/OKCMAR as distributed by MLS GRID #1132362 Report a problem | ||
| 10/21/2024 | Price change | $120,000-14.3%$96/sqft |
Source: MLSOK/OKCMAR as distributed by MLS GRID #1132362 Report a problem | ||
| 10/2/2024 | Price change | $139,999-5.1%$112/sqft |
Source: MLSOK/OKCMAR as distributed by MLS GRID #1132362 Report a problem | ||
| 9/19/2024 | Price change | $147,500-11.9%$118/sqft |
Source: MLSOK/OKCMAR as distributed by MLS GRID #1132362 Report a problem | ||
| 8/28/2024 | Listed for sale | $167,500+28.8%$134/sqft |
Source: MLSOK/OKCMAR as distributed by MLS GRID #1132362 Report a problem | ||
| 6/1/2022 | Listing removed | -- |
Source: MLSOK/OKCMAR as distributed by MLS GRID #1001480 Report a problem | ||
| 5/16/2022 | Listed for sale | $130,000$104/sqft |
Source: MLSOK/OKCMAR as distributed by MLS GRID #1001480 Report a problem | ||
| 4/21/2022 | Pending sale | $130,000$104/sqft |
Source: MLSOK/OKCMAR as distributed by MLS GRID #1001480 Report a problem | ||
| 4/15/2022 | Price change | $130,000-3.7%$104/sqft |
Source: MLSOK/OKCMAR as distributed by MLS GRID #1001480 Report a problem | ||
| 4/8/2022 | Listed for sale | $135,000$108/sqft |
Source: MLSOK/OKCMAR as distributed by MLS GRID #1001480 Report a problem | ||
| 4/2/2022 | Pending sale | $135,000$108/sqft |
Source: MLSOK/OKCMAR as distributed by MLS GRID #1001480 Report a problem | ||
| 3/28/2022 | Listed for sale | $135,000+9.3%$108/sqft |
Source: MLSOK/OKCMAR as distributed by MLS GRID #1001480 Report a problem | ||
| 3/25/2022 | Listing removed | -- |
Source:  Exit Realty Report a problem | ||
| 3/24/2022 | Listed for sale | $123,500$99/sqft |
Source: MLSOK/OKCMAR as distributed by MLS GRID #992551 Report a problem | ||
| 3/16/2022 | Pending sale | $123,500$99/sqft |
Source: MLSOK/OKCMAR as distributed by MLS GRID #992551 Report a problem | ||
| 2/28/2022 | Price change | $123,500-1.2%$99/sqft |
Source: MLSOK/OKCMAR as distributed by MLS GRID #992551 Report a problem | ||
| 2/12/2022 | Listed for sale | $125,000$100/sqft |
Source: MLSOK/OKCMAR as distributed by MLS GRID #992551 Report a problem | ||
| 2/7/2022 | Pending sale | $125,000$100/sqft |
Source: MLSOK/OKCMAR as distributed by MLS GRID #992551 Report a problem | ||
| 1/23/2022 | Listed for sale | $125,000$100/sqft |
Source: MLSOK/OKCMAR as distributed by MLS GRID #992551 Report a problem | ||
| 12/30/2021 | Listing removed | -- |
Source: Exit Realty Report a problem | ||
| 12/25/2021 | Listed for sale | $125,000+6.8%$100/sqft |
Source: MLSOK/OKCMAR as distributed by MLS GRID #989503 Report a problem | ||
| 11/10/2021 | Sold | $117,000+350%$94/sqft |
Source: MLSOK/OKCMAR as distributed by MLS GRID #972641 Report a problem | ||
| 3/3/2016 | Sold | $26,000$21/sqft |
Source: Public Record Report a problem | ||
Public tax history
| Year | Property taxes | Tax assessment |
|---|---|---|
| 2025 | $1,738 +2.8% | $15,152 +5% |
| 2024 | $1,691 +9.4% | $14,431 +5% |
| 2023 | $1,546 +15.4% | $13,744 +5% |
| 2022 | $1,339 +55.5% | $13,090 +74.4% |
| 2021 | $861 +2.3% | $7,507 +5% |
| 2020 | $842 +25.3% | $7,150 -0.2% |
| 2019 | $672 +5% | $7,161 +5% |
| 2018 | $640 -19.5% | $6,820 +0% |
| 2017 | $795 | $6,819 |
| 2016 | $795 -2.7% | $6,819 +0.3% |
| 2015 | $817 -0.5% | $6,798 -0.5% |
| 2014 | $822 | $6,833 -2.2% |
| 2013 | -- | $6,988 -0.3% |
| 2012 | -- | $7,008 -5.4% |
| 2011 | -- | $7,411 -0.7% |
| 2010 | -- | $7,460 +5% |
| 2009 | -- | $7,104 +5% |
| 2008 | -- | $6,767 +5% |
| 2007 | -- | $6,444 +5% |
| 2006 | -- | $6,137 +5% |
| 2005 | -- | $5,845 -88.5% |
| 2004 | $505 | $50,617 +809.2% |
| 2003 | -- | $5,567 +10.8% |
| 2002 | -- | $5,024 +10.3% |
| 2001 | -- | $4,555 +6.3% |
| 2000 | -- | $4,285 |
| 1999 | -- | $4,285 |
Find assessor info on the county website
Monthly payment
Est. payment
Payment breakdown
Explore the cost of this home by adjusting the details. Changes won't be saved.Climate risks
Neighborhood: 73115
Nearby schools
Schools provided by the listing agent
- Elementary: Epperly Heights ES
- Middle: Del City MS
- High: Del City HS
Source: MLSOK/OKCMAR as distributed by MLS GRID. This data may not be complete. We recommend contacting the local school district to confirm school assignments for this home.


Similar homes
- $155,9003 bd2 ba1.5k sqft3216 SE 19th St, Del City, OK 73115For Sale
 MLS ID #1247291, Kashala Smith, Hoppis Real Estate Srvs, Inc. MLSOK/OKCMAR as distributed by MLS GRID
- $178,0004 bd3 ba1.5k sqft4749 Spiva Dr, Oklahoma City, OK 73115For Sale
 MLS ID #1258787, Jin Qiu Huang, Chinowth & Cohen. MLSOK/OKCMAR as distributed by MLS GRID
- $130,0003 bd1 ba987 sqft3601 Parkwoods Ln, Midwest City, OK 73110For Sale
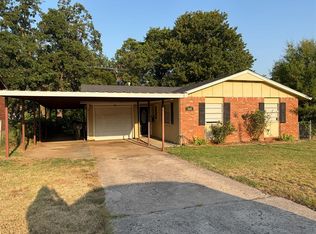 MLS ID #1257670, Rachael Cockerell, Peak 46 Properties, LLC. MLSOK/OKCMAR as distributed by MLS GRID
- $125,0004 bd2 ba1.8k sqft2900 SE 57th St, Oklahoma City, OK 73129For Sale
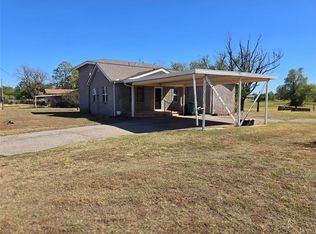 MLS ID #1252412, Jeanie Wilson, Metro First Realty Group. MLSOK/OKCMAR as distributed by MLS GRID
