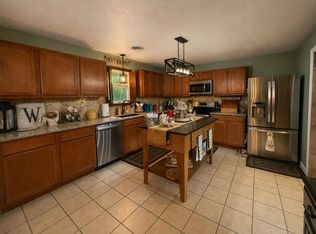
$290,400
4 bd3 ba2.5k sqft
200 Dogwood Ct, Daniels, WV 25832
Off Market

Zillow last checked:
Listing updated:
Jeremy Miller 304-207-7279,
FAIRCHILD REAL ESTATE

$293,700
$279,000 - $308,000
$2,081/mo
| Date | Event | Price |
|---|---|---|
| 11/11/2026 | Price change | $309,000-3.4%$118/sqft |
Source: My State MLS #11993295 Report a problem | ||
| 9/20/2026 | Listed for sale | $319,900+60%$122/sqft |
Source: My State MLS #11993295 Report a problem | ||
| 1/14/2022 | Sold | $200,000-8.7%$77/sqft |
Source:  Beckley BOR #80629 Report a problem | ||
| 9/30/2021 | Listed for sale | $219,000+14500%$84/sqft |
Source: Beckley BOR #80629 Report a problem | ||
| 10/28/2020 | Listing removed | $1,900$1/sqft |
Source: GLADE SPRINGS REAL ESTATE #79440 Report a problem | ||
| 10/22/2020 | Listed for rent | $1,900+26.7%$1/sqft |
Source: GLADE SPRINGS REAL ESTATE #79440 Report a problem | ||
| 3/6/2018 | Listing removed | $1,500$1/sqft |
Source: Owner Report a problem | ||
| 2/3/2018 | Listed for rent | $1,500$1/sqft |
Source: Owner Report a problem | ||
| 8/29/2016 | Sold | $1,500-99.3%$1/sqft |
Source: All West Virginia MLS #69826 Report a problem | ||
| 6/14/2016 | Listed for sale | $229,000+1.8%$88/sqft |
Source: GLADE SPRINGS REAL ESTATE #69536 Report a problem | ||
| 5/3/2016 | Listing removed | $1,500-6.3%$1/sqft |
Source: Owner Report a problem | ||
| 12/22/2015 | Listed for rent | $1,600$1/sqft |
Source: Owner Report a problem | ||
| 11/29/2015 | Listing removed | $225,000$86/sqft |
Source: Owner Report a problem | ||
| 5/18/2015 | Listed for sale | $225,000+12.5%$86/sqft |
Source: Owner Report a problem | ||
| 7/18/2011 | Sold | $200,000$77/sqft |
Source: Public Record Report a problem | ||
| Year | Property taxes | Tax assessment |
|---|---|---|
| 2026 | $1,671 +4.8% | $138,360 +4.8% |
| 2025 | $1,595 +10.7% | $132,000 +10.1% |
| 2024 | $1,440 +4.8% | $119,880 +4.8% |
| 2023 | $1,374 -14.8% | $114,360 -14.8% |
| 2022 | $1,613 | $134,280 +2% |
| 2021 | -- | $131,700 -0.9% |
| 2020 | -- | $132,960 |
| 2019 | $1,607 -0.9% | $132,960 -0.9% |
| 2018 | $1,622 | $134,220 |
| 2017 | $1,622 -2.5% | $134,220 -0.9% |
| 2016 | $1,664 +3.2% | $135,480 +3.2% |
| 2015 | $1,612 | $131,280 |
| 2014 | $1,612 +2.7% | $131,280 +7.6% |
| 2013 | $1,570 | $122,040 -4.6% |
| 2012 | $1,570 +7.9% | $127,860 |
| 2011 | $1,455 +4.4% | $127,860 +4.4% |
| 2010 | $1,394 +4.3% | $122,460 +4.3% |
| 2009 | $1,336 +20.4% | $117,420 +26.7% |
| 2008 | $1,110 +2.4% | $92,700 +4.3% |
| 2007 | $1,084 +0.4% | $88,860 +2.1% |
| 2006 | $1,080 +0.4% | $87,000 +1.8% |
| 2005 | $1,075 | $85,440 +18.9% |
| 2003 | -- | $71,880 +11% |
| 2002 | -- | $64,740 +4.4% |
| 2001 | -- | $62,040 |
Source: Beckley BOR. This data may not be complete. We recommend contacting the local school district to confirm school assignments for this home.


A local agent can set up tours, give advice and negotiate with sellers.
A local lender can help you make sure your offer is ready when you are.