$601,150
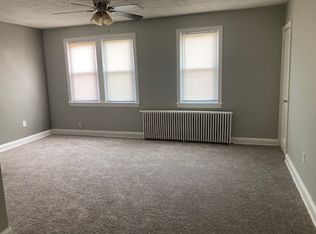
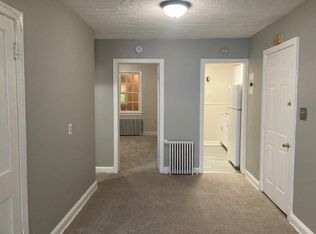
4 bd|4 ba|2.8k sqft
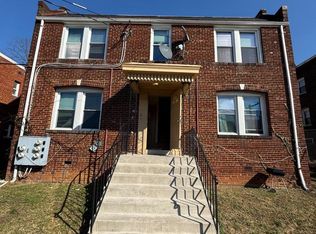
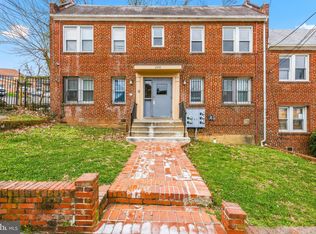
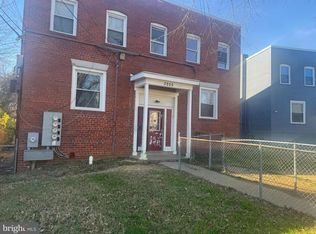
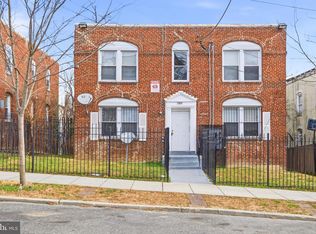
2319 Green St SE, Washington, DC 20020
Off Market
Likely to sell faster than
Zillow last checked:
Listing updated:
Ari Firoozabadi 202-280-2722,
Greysteel Company LLC
$740,900
$704,000 - $778,000
$3,180/mo
| Date | Event | Price |
|---|---|---|
| 5/6/2026 | Listed for sale | $750,000-9.1%$260/sqft |
Source: | ||
| 4/7/2026 | Listed for rent | $2,300$1/sqft |
Source: Zillow Rentals Report a problem | ||
| 3/31/2026 | Listing removed | $825,000$286/sqft |
Source: | ||
| 3/12/2026 | Listed for sale | $825,000-8.3%$286/sqft |
Source: | ||
| 2/19/2026 | Contingent | $900,000$312/sqft |
Source: | ||
| 1/7/2026 | Listed for sale | $900,000+291.3%$312/sqft |
Source: | ||
| 11/13/2025 | Listing removed | $2,300$1/sqft |
Source: Zillow Rentals Report a problem | ||
| 6/13/2025 | Listed for rent | $2,300$1/sqft |
Source: Zillow Rentals Report a problem | ||
| 5/20/2013 | Sold | $230,000-46.5%$80/sqft |
Source: Public Record Report a problem | ||
| 3/5/2007 | Sold | $430,000+241.5%$149/sqft |
Source: Public Record Report a problem | ||
| 1/25/1999 | Sold | $125,909+259.7%$44/sqft |
Source: Public Record Report a problem | ||
| 5/21/1998 | Sold | $35,000$12/sqft |
Source: Public Record Report a problem | ||
| Year | Property taxes | Tax assessment |
|---|---|---|
| 2025 | $5,484 +1.2% | $645,180 +1.2% |
| 2024 | $5,419 +3.4% | $637,480 +3.4% |
| 2023 | $5,241 +11.4% | $616,550 +11.4% |
| 2022 | $4,702 +13.8% | $553,220 +13.8% |
| 2021 | $4,131 +6.1% | $486,000 +6.1% |
| 2020 | $3,895 +21.9% | $458,210 +21.9% |
| 2018 | $3,196 +3.2% | $376,030 +3.2% |
| 2017 | $3,096 +11.1% | $364,210 +11.1% |
| 2016 | $2,787 +4.9% | $327,920 +4.9% |
| 2015 | $2,657 +19.2% | $312,630 +19.2% |
| 2014 | $2,230 +2.2% | $262,300 +2.2% |
| 2013 | $2,182 -14.9% | $256,710 -14.9% |
| 2012 | $2,565 | $301,800 |
| 2011 | $2,565 -19.2% | $301,800 -19.2% |
| 2010 | $3,176 -1.4% | $373,600 -1.4% |
| 2009 | $3,219 +24.8% | $378,730 +29.2% |
| 2007 | $2,580 +65.3% | $293,220 +72.8% |
| 2006 | $1,561 +0.1% | $169,690 +4.4% |
| 2005 | $1,560 +10.1% | $162,480 +10.1% |
| 2004 | $1,416 +13.9% | $147,520 +13.9% |
| 2003 | $1,243 +13% | $129,510 +13% |
| 2002 | $1,100 -16.5% | $114,606 |
| 2001 | $1,318 | $114,606 |
Find assessor info on the county website
Source: Bright MLS. This data may not be complete. We recommend contacting the local school district to confirm school assignments for this home.
A local agent can set up tours, give advice and negotiate with sellers.