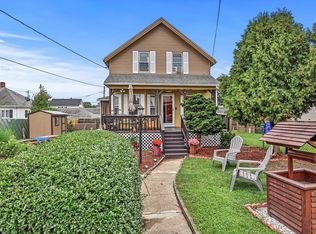
Move right into this well-maintained single family home. Set back with a large front yard that provides added privacy from the road, this property offers both comfort and convenience. The side deck was completely rebuilt just two years ago, creating the perfect outdoor space for relaxing or entertaining. An installed camera and alarm system adds peace of mind, while easy highway access makes commuting simple. A true move-in ready opportunity close to everything Fall River has to offer. Subject to seller finding suitable housing.
Pending
Price cut: $10K (6/3)
$389,000
249 Baird St, Fall River, MA 02721
2beds
922sqft
Single Family Residence
Built in 1930
6,233 Square Feet Lot
$405,900 Zestimate®
$422/sqft
$-- HOA
What's special
- 55 days |
- 87 |
- 3 |
Likely to sell faster than
Zillow last checked:
Listing updated:
Listed by:
Ellen Oaklund 401-699-3269,
Serhant 617-250-0559
Source: MLS PIN,MLS#: 73521857
Facts & features
Interior
Bedrooms & bathrooms
- Bedrooms: 2
- Bathrooms: 2
- Full bathrooms: 1
- 1/2 bathrooms: 1
Heating
- Baseboard, Natural Gas
Cooling
- None
Features
- Basement: Full,Unfinished
- Has fireplace: No
Interior area
- Total structure area: 922
- Total interior livable area: 922 sqft
- Finished area above ground: 922
Property
Parking
- Total spaces: 2
- Uncovered spaces: 2
Lot
- Size: 6,233 Square Feet
- Features: Level
Details
- Parcel number: M:0E23 B:0000 L:0022,2823968
- Zoning: R-4
Construction
Type & style
- Home type: SingleFamily
- Architectural style: Cottage
- Property subtype: Single Family Residence
Materials
- Foundation: Concrete Perimeter
Condition
- Year built: 1930
Utilities & green energy
- Sewer: Public Sewer
- Water: Public
Community & HOA
HOA
- Has HOA: No
Location
- Region: Fall River
Financial & listing details
- Price per square foot: $422/sqft
- Tax assessed value: $289,700
- Annual tax amount: $3,317
- Date on market: 5/20/2026
Estimated market value
$405,900
$386,000 - $426,000
$2,092/mo
Price history
| Date | Event | Price |
|---|---|---|
| 6/25/2026 | Pending sale | $389,000$422/sqft |
Source: MLS PIN #73521857 Report a problem | ||
| 6/11/2026 | Contingent | $389,000$422/sqft |
Source: MLS PIN #73521857 Report a problem | ||
| 6/3/2026 | Price change | $389,000-2.5%$422/sqft |
Source: MLS PIN #73521857 Report a problem | ||
| 5/20/2026 | Listed for sale | $399,000+20.9%$433/sqft |
Source: MLS PIN #73521857 Report a problem | ||
| 10/24/2022 | Listing removed | -- |
Source: | ||
| 7/8/2022 | Sold | $329,900$358/sqft |
Source: MLS PIN #72992067 Report a problem | ||
| 7/8/2022 | Pending sale | $329,900$358/sqft |
Source: | ||
| 7/8/2022 | Listing removed | -- |
Source: | ||
| 6/10/2022 | Pending sale | $329,900$358/sqft |
Source: | ||
| 6/10/2022 | Contingent | $329,900$358/sqft |
Source: MLS PIN #72992067 Report a problem | ||
| 6/3/2022 | Listed for sale | $329,900+0.9%$358/sqft |
Source: MLS PIN #72992067 Report a problem | ||
| 6/7/2021 | Sold | $327,000+5.8%$355/sqft |
Source: | ||
| 4/23/2021 | Pending sale | $309,000$335/sqft |
Source: | ||
| 4/23/2021 | Contingent | $309,000$335/sqft |
Source: | ||
| 4/17/2021 | Listed for sale | $309,000+34.8%$335/sqft |
Source: | ||
| 1/18/2019 | Sold | $229,288+2%$249/sqft |
Source: Public Record Report a problem | ||
| 12/10/2018 | Price change | $224,888-2.2%$244/sqft |
Source: Arrow Realty Group, Inc. #72423091 Report a problem | ||
| 11/13/2018 | Listed for sale | $229,888+70.3%$249/sqft |
Source: Arrow Realty Group, Inc. #72423091 Report a problem | ||
| 9/14/2018 | Sold | $135,000-6.9%$146/sqft |
Source: Public Record Report a problem | ||
| 9/14/2012 | Listing removed | $145,000$157/sqft |
Source: RE/MAX Right Choice #71302887 Report a problem | ||
| 8/11/2012 | Price change | $145,000-1.7%$157/sqft |
Source: RE/MAX Right Choice #71302887 Report a problem | ||
| 8/4/2012 | Price change | $147,500-1.3%$160/sqft |
Source: RE/MAX Right Choice #71302887 Report a problem | ||
| 1/15/2012 | Price change | $149,500-6.5%$162/sqft |
Source: RE/MAX Right Choice #71302887 Report a problem | ||
| 10/23/2011 | Listed for sale | $159,900-25.3%$173/sqft |
Source: RE/MAX Right Choice #71302887 Report a problem | ||
| 7/25/2008 | Sold | $214,000-0.5%$232/sqft |
Source: Public Record Report a problem | ||
| 5/28/2008 | Listed for sale | $215,000+67.3%$233/sqft |
Source: MLS Property Information Network #70733937 Report a problem | ||
| 12/14/2007 | Sold | $128,482-13.8%$139/sqft |
Source: Public Record Report a problem | ||
| 10/31/2005 | Sold | $149,000$162/sqft |
Source: Public Record Report a problem | ||
Public tax history
| Year | Property taxes | Tax assessment |
|---|---|---|
| 2025 | $3,317 +7.2% | $289,700 +7.6% |
| 2024 | $3,094 -5.5% | $269,300 +0.9% |
| 2023 | $3,275 +13.7% | $266,900 +16.9% |
| 2022 | $2,881 +7.3% | $228,300 +17.6% |
| 2021 | $2,684 0% | $194,100 +4.5% |
| 2020 | $2,685 +4.6% | $185,800 +5.6% |
| 2019 | $2,566 +8.9% | $176,000 +9.2% |
| 2018 | $2,357 +3.9% | $161,200 -0.5% |
| 2017 | $2,268 +3.4% | $162,000 +0.6% |
| 2016 | $2,194 +6.2% | $161,000 +2% |
| 2015 | $2,065 +1.3% | $157,900 -2.6% |
| 2014 | $2,039 +4.4% | $162,100 -1% |
| 2013 | $1,954 +7.8% | $163,800 -0.7% |
| 2012 | $1,812 +11.7% | $165,000 -8% |
| 2010 | $1,622 +29.1% | $179,400 +15.1% |
| 2009 | $1,256 -21.2% | $155,800 -25% |
| 2008 | $1,593 +29.2% | $207,700 +21% |
| 2007 | $1,233 +4.1% | $171,700 -0.9% |
| 2006 | $1,184 +9.2% | $173,300 +21.6% |
| 2005 | $1,084 +6.1% | $142,500 +14.5% |
| 2004 | $1,022 +20.2% | $124,500 +56.8% |
| 2003 | $850 +8.8% | $79,400 |
| 2002 | $781 +0.4% | $79,400 +6.7% |
| 2000 | $778 +25.7% | $74,400 +10.4% |
| 1995 | $619 | $67,400 |
Find assessor info on the county website
Monthly payment
Est. payment
Payment breakdown
Explore the cost of this home by adjusting the details. Changes won't be saved.Climate risks
Neighborhood: Maplewood
Nearby schools
GreatSchools rating
- 5/10Letourneau Elementary SchoolGrades: K-5Distance: 0.8 mi
- 4/10Talbot Innovation SchoolGrades: 6-8Distance: 1.3 mi
- 2/10B M C Durfee High SchoolGrades: 9-12Distance: 2.5 mi
- $461,2003 bd2 ba2.5k sqft243 Baird St, Fall River, MA 02721Off Market
- $355,0003 bd2 ba956 sqft259 Baird St, Fall River, MA 02721Sold
- $446,2003 bd1 ba1.5k sqft48 McGee St, Fall River, MA 02721Off Market
- $--1 bd1 ba600 sqft40 McGee St #3, Fall River, MA 02721Off Market
- $--1 bd1 ba575 sqft40 McGee St APT 1, Fall River, MA 02721Off Market
- $--1 bd1 ba575 sqft40 McGee St #1-2, Fall River, MA 02721Off Market
- $--2 bd1 ba678 sqft40 McGee St APT 2, Fall River, MA 02721Off Market
- $419,3003 bd2 ba1.2k sqft231 Baird St, Fall River, MA 02721Off Market
A local agent can set up tours, give advice and negotiate with sellers.
Similar homes
- $399,9003 bd1 ba886 sqft452 Tecumseh St, Fall River, MA 02721For Sale
 MLS ID #73534831, TJ George, Gibson Sotheby's International Realty. MLS PIN
 - $439,9004 bd2 ba1.2k sqft177 Anthony St, Fall River, MA 02721For Sale
 MLS ID #73546071, The Ponte Group, Keller Williams South Watuppa. MLS PIN
 - $379,0002 bd3 ba984 sqft31 Sachem St, Fall River, MA 02724For Sale
 MLS ID #73501443, Felicia Knight, RE/MAX Impact. MLS PIN
 - $425,0003 bd2 ba1.2k sqft96 Star St, Fall River, MA 02724For Sale
 MLS ID #73504413, Emanuel Galante, Keller Williams South Watuppa. MLS PIN
 - $349,9001 bd1 ba962 sqft415 Anthony St, Fall River, MA 02721For SaleMLS ID #73545003, Christopher Woodard, Keller Williams Coastal. MLS PIN
- $339,9003 bd1 ba1k sqft27 Johnson St, Fall River, MA 02723For SaleMLS ID #73546648, Jonathan Bolano, eXp Realty LLC. MLS PIN
- $460,0004 bd2 ba1.1k sqft17 Langley St, Fall River, MA 02720For SaleMLS ID #73547931, Thaina Fournier, eXp Realty LLC. MLS PIN
- $414,9003 bd1 ba936 sqft1243 New Boston Rd, Fall River, MA 02720For SaleMLS ID #73516367, Genevieve Pappas, Lamacchia Realty, Inc.. MLS PIN
- $474,0003 bd3 ba1.1k sqft36 McGowan St, Fall River, MA 02723For SaleMLS ID #73531114, Wendy Sampson, Lion Gate Real Estate, Inc.. MLS PIN
- $419,9002 bd1 ba1k sqft22 Hathaway Rd, Dartmouth, MA 02747For SaleMLS ID #73547310, Jessica Andrade, RE/MAX River's Edge. MLS PIN
- $395,0003 bd1 ba1k sqft27 Hinsdale St, Swansea, MA 02777For SaleMLS ID #73541475, Mark Mello, Coldwell Banker Realty. MLS PIN
- $349,9001 bd1 ba988 sqftLanding At South Park, Fall River, MA 02721For SaleMLS ID #73547495, Susan Colombo, Colombo Real Estate. MLS PIN
- $389,0002 bd2 ba1.1k sqft61 Flagg Swamp Rd, East Freetown, MA 02717For SaleMLS ID #73536278, Linda Perry, Lamacchia Realty, Inc. MLS PIN
- $490,0004 bd2 ba1.2k sqft212 Haffards St, Fall River, MA 02723For SaleMLS ID #73543284, Paula Levasseur, Home Bound Realty. MLS PIN
- $335,0003 bd2 ba1.3k sqft22 Montgomery St, Fall River, MA 02720For SaleMLS ID #73496588, Brendan Henry, Redfin Corp.. MLS PIN
- $520,0003 bd2 ba1.3k sqft109 Jackson Ave, Somerset, MA 02725For SaleMLS ID #73545277, Wendy Sampson, Lion Gate Real Estate, Inc.. MLS PIN
- $419,9002 bd1 ba920 sqft972 Elliot St, New Bedford, MA 02745For SaleMLS ID #73547440, Vickie Cortes, eXp Realty LLC. MLS PIN
- $419,9002 bd1 ba905 sqft126 Ocean View Ave, Swansea, MA 02777For SaleMLS ID #73514149, Lexi Cardoso, Residential Properties Ltd. - East Side. MLS PIN
- $289,0002 bd1 ba854 sqft615 Robeson St, Fall River, MA 02720For SaleMLS ID #73532136, Jaiannah DeMello, RE/MAX Vantage. MLS PIN
- $390,0003 bd2 ba1.3k sqft19 Dryden Blvd, Warwick, RI 02888For Sale
 MLS ID #1417230, Heath Dugas, BHHS New England Properties. StateWide MLS RI
