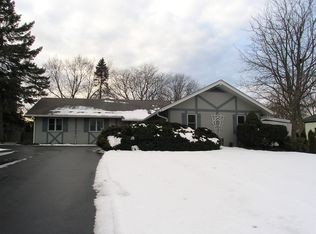
Gorgeous home located in the heart of downtown Frankfort! This 4-bedroom, 2-bathroom residence with detached two car garage offers the perfect blend of comfort and modern living. Just off the front entry you will find the oversized covered porch which invites you to unwind while enjoying the neighborhood's charm. As you enter, the foyer leads into the living room with gleaming refinished hardwood floors, original woodwork and natural light galore. Perfect for hosting, the separate dining room flows effortlessly into a modern kitchen equipped with stainless steel appliances and beautiful granite counter tops. The main floor also includes a bedroom, a full bathroom, and a separate office, offering flexible living space. Upstairs discover an inviting layout featuring a spacious primary suite complete with a generous walk-in closet. Two additional bedrooms both with walk in closets and an over-sized full bathroom with claw foot tub. Downstairs the full, unfinished basement is a blank canvas, offering incredible potential to create the ultimate recreation room, home gym, or media center. It already includes a dedicated laundry area and provides abundant storage. The private backyard patio, surrounded by professional landscaping, creates a serene outdoor oasis. Don't miss this opportunity to own a piece of Frankfort's downtown charm.
Re-activated
$539,900
256 Center Rd, Frankfort, IL 60423
4beds
2,200sqft
Single Family Residence
Built in 1915
0.28 Acres Lot
$-- Zestimate®
$245/sqft
$-- HOA
What's special
Original woodworkSeparate officeSurrounded by professional landscapingSerene outdoor oasisInviting layoutPrivate backyard patioNatural light galore
- 36 days |
- 1,507 |
- 60 |
Zillow last checked:
Listing updated:
Listed by:
Bridget McCann 773-726-9424,
Baird & Warner
Source: MRED as distributed by MLS GRID,MLS#: 12659015
Loading...
Facts & features
Interior
Bedrooms & bathrooms
- Bedrooms: 4
- Bathrooms: 2
- Full bathrooms: 2
Rooms
- Room types: Foyer, Office, Recreation Room, Storage
Primary bedroom
- Features: Flooring (Wood Laminate)
- Level: Second
- Area: 209 Square Feet
- Dimensions: 19X11
Bedroom 2
- Features: Flooring (Carpet)
- Level: Second
- Area: 210 Square Feet
- Dimensions: 21X10
Bedroom 3
- Features: Flooring (Hardwood)
- Level: Second
- Area: 132 Square Feet
- Dimensions: 12X11
Bedroom 4
- Features: Flooring (Hardwood)
- Level: Main
- Area: 132 Square Feet
- Dimensions: 11X12
Dining room
- Features: Flooring (Hardwood)
- Level: Main
- Area: 165 Square Feet
- Dimensions: 15X11
Foyer
- Features: Flooring (Hardwood)
- Level: Main
- Area: 63 Square Feet
- Dimensions: 9X7
Kitchen
- Features: Kitchen (Eating Area-Table Space)
- Level: Main
- Area: 176 Square Feet
- Dimensions: 16X11
Laundry
- Level: Basement
- Area: 208 Square Feet
- Dimensions: 13X16
Living room
- Features: Flooring (Hardwood)
- Level: Main
- Area: 216 Square Feet
- Dimensions: 12X18
Office
- Features: Flooring (Hardwood)
- Level: Main
- Area: 99 Square Feet
- Dimensions: 9X11
Recreation room
- Level: Basement
- Area: 350 Square Feet
- Dimensions: 25X14
Storage
- Level: Basement
- Area: 264 Square Feet
- Dimensions: 24X11
Heating
- Natural Gas, Sep Heating Systems - 2+
Cooling
- Central Air
Appliances
- Included: Double Oven, Microwave, Dishwasher, Refrigerator, Washer, Dryer, Stainless Steel Appliance(s), Water Softener Owned
Features
- 1st Floor Bedroom, 1st Floor Full Bath, Built-in Features, Walk-In Closet(s), Granite Counters, Separate Dining Room
- Flooring: Hardwood
- Windows: Screens
- Basement: Unfinished,Full
Interior area
- Total structure area: 3,073
- Total interior livable area: 2,200 sqft
Video & virtual tour
Property
Parking
- Total spaces: 2
- Parking features: Asphalt, Garage Door Opener, Yes, Garage Owned, Detached, Garage
- Garage spaces: 2
- Has uncovered spaces: Yes
Accessibility
- Accessibility features: No Disability Access
Features
- Stories: 2
- Patio & porch: Patio
Lot
- Size: 0.28 Acres
Details
- Parcel number: 1909282270200000
- Special conditions: None
- Other equipment: Water-Softener Owned, Sump Pump
Construction
Type & style
- Home type: SingleFamily
- Property subtype: Single Family Residence
Materials
- Wood Siding
- Roof: Asphalt
Condition
- New construction: No
- Year built: 1915
Utilities & green energy
- Sewer: Public Sewer
- Water: Shared Well
Community & HOA
Community
- Features: Curbs, Street Lights, Street Paved
- Subdivision: Old Frankfort
HOA
- Services included: None
Location
- Region: Frankfort
Financial & listing details
- Price per square foot: $245/sqft
- Tax assessed value: $320,343
- Annual tax amount: $7,826
- Date on market: 5/27/2026
- Ownership: Fee Simple
Estimated market value
Not available
Estimated sales range
Not available
Not available
Price history
| Date | Event | Price |
|---|---|---|
| 5/27/2026 | Listed for sale | $539,900-1.8%$245/sqft |
Source: | ||
| 5/27/2026 | Listing removed | $549,900$250/sqft |
Source: MRED as distributed by MLS GRID #12588979 Report a problem | ||
| 4/15/2026 | Listed for sale | $549,900+25%$250/sqft |
Source: | ||
| 8/23/2024 | Sold | $440,000-2.2%$200/sqft |
Source: | ||
| 7/4/2024 | Price change | $449,900-4.1%$205/sqft |
Source: | ||
| 6/11/2024 | Listed for sale | $469,000-2.1%$213/sqft |
Source: | ||
| 5/21/2024 | Listing removed | $479,000$218/sqft |
Source: | ||
| 3/6/2024 | Listed for sale | $479,000$218/sqft |
Source: | ||
| 3/1/2024 | Pending sale | $479,000$218/sqft |
Source: | ||
| 3/1/2024 | Contingent | $479,000$218/sqft |
Source: | ||
| 2/23/2024 | Price change | $479,000-4%$218/sqft |
Source: | ||
| 1/15/2024 | Listed for sale | $499,000$227/sqft |
Source: | ||
| 12/27/2023 | Listing removed | $499,000$227/sqft |
Source: | ||
| 11/10/2023 | Listed for sale | $499,000+194.4%$227/sqft |
Source: | ||
| 4/16/1998 | Sold | $169,500+18.5%$77/sqft |
Source: Public Record Report a problem | ||
| 7/5/1996 | Sold | $143,000$65/sqft |
Source: Public Record Report a problem | ||
Public tax history
| Year | Property taxes | Tax assessment |
|---|---|---|
| 2024 | $7,826 +6% | $106,781 +12% |
| 2023 | $7,383 +7.6% | $95,366 +9.8% |
| 2022 | $6,863 +6.2% | $86,862 +6.9% |
| 2021 | $6,459 +2.6% | $81,263 +2.9% |
| 2020 | $6,294 +3.4% | $78,973 +2.8% |
| 2019 | $6,086 +1.9% | $76,859 +3% |
| 2018 | $5,973 +0.1% | $74,650 +2.4% |
| 2017 | $5,964 +2.5% | $72,908 +3.6% |
| 2016 | $5,818 +2.7% | $70,408 +3.6% |
| 2015 | $5,665 | $67,929 +0.7% |
| 2014 | $5,665 +1.4% | $67,457 -1.3% |
| 2013 | $5,588 -0.2% | $68,332 -5% |
| 2012 | $5,600 -0.7% | $71,929 -5% |
| 2011 | $5,637 +1.4% | $75,715 -3.5% |
| 2010 | $5,558 +3.3% | $78,461 -2.8% |
| 2009 | $5,382 -6.4% | $80,681 -7.6% |
| 2008 | $5,751 | $87,361 +2.5% |
| 2007 | -- | $85,230 +7.5% |
| 2006 | $5,296 +5.3% | $79,283 +8.4% |
| 2005 | $5,031 +7% | $73,126 +8% |
| 2004 | $4,703 +2.1% | $67,709 +5.1% |
| 2003 | $4,608 +7.8% | $64,411 +6.6% |
| 2002 | $4,276 +0% | $60,434 +1.9% |
| 2001 | $4,276 +6% | $59,325 +5% |
| 2000 | $4,034 | $56,500 |
Find assessor info on the county website
Monthly payment
Est. payment$--/mo
Payment breakdown
Explore the cost of this home by adjusting the details. Changes won't be saved.All calculations are estimates and provided by Zillow, Inc. for informational purposes only. Actual amounts may vary.
HOA fees may include property taxes on listings classified as Co-Ops. Contact the listing agent and/or owner for fee details.
Mortgage interest rates are dependent on a number of factors, including credit score, down payment, and repayment length. Interest rate data provided by Zillow Group Marketplace, Inc. as of 1/1/1970 from various mortgage lenders with which we have lead or other similar arrangements; the Estimated Payment is an average of those rates.
See how much you could borrow to make a competitive offer.
Climate risks
Neighborhood: 60423
Nearby schools
GreatSchools rating
- NAGrand Prairie Elementary SchoolGrades: PK-2Distance: 1.3 mi
- 10/10Hickory Creek Middle SchoolGrades: 6-8Distance: 2.7 mi
- 8/10Lincoln-Way East High SchoolGrades: 9-12Distance: 1.4 mi
Schools provided by the listing agent
- Elementary: Grand Prairie Elementary School
- Middle: Hickory Creek Middle School
- High: Lincoln-Way East High School
- District: 157C
Source: MRED as distributed by MLS GRID. This data may not be complete. We recommend contacting the local school district to confirm school assignments for this home.
A local agent can set up tours, give advice and negotiate with sellers.


- Illinois
- Will County
- Frankfort
- 60423
- 256 Center Rd
Nearby cities
Nearby neighborhoods
Nearby zip codes
Other Frankfort Topics
