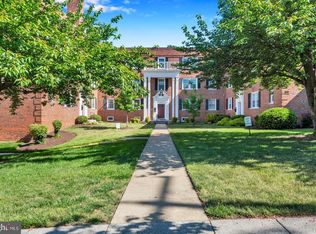
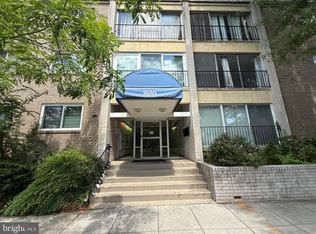
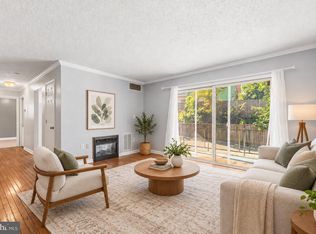
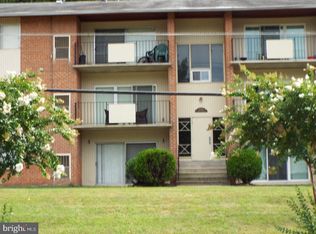
$150,000
2 bd1 ba758 sqft
2636 Wade Rd SE APT 24, Washington, DC 20020
Coming Soon
Zillow last checked:
Listing updated:
Paul Muller 845-264-3469,
KW Metro Center

Not available
Estimated sales range
Not available
Not available
| Date | Event | Price |
|---|---|---|
| 7/12/2024 | Sold | $112,000$148/sqft |
Source:  Bright MLS #DCDC2145356 Report a problem | ||
| 6/28/2024 | Pending sale | $112,000$148/sqft |
Source: Bright MLS #DCDC2145356 Report a problem | ||
| 6/11/2024 | Price change | $112,000-13.8%$148/sqft |
Source: Bright MLS #DCDC2145356 Report a problem | ||
| 6/7/2024 | Listed for sale | $130,000+8.3%$172/sqft |
Source: Bright MLS #DCDC2145356 Report a problem | ||
| 5/7/2024 | Listing removed | -- |
Source: Bright MLS #DCDC2097528 Report a problem | ||
| 12/11/2023 | Listed for sale | $120,000$158/sqft |
Source: Bright MLS #DCDC2097528 Report a problem | ||
| 10/30/2023 | Pending sale | $120,000$158/sqft |
Source: Bright MLS #DCDC2097528 Report a problem | ||
| 6/23/2023 | Listed for sale | $120,000+341.4%$158/sqft |
Source: Bright MLS #DCDC2097528 Report a problem | ||
| 2/25/2011 | Sold | $27,188-2.6%$36/sqft |
Source: Public Record Report a problem | ||
| 1/15/2011 | Price change | $27,900-14.2%$37/sqft |
Source: foreclosure.com Report a problem | ||
| 12/4/2010 | Price change | $32,500-16.9%$43/sqft |
Source: Daniels Realty, LLC #DC7454256 Report a problem | ||
| 10/8/2010 | Price change | $39,114-57%$52/sqft |
Source: foreclosure.com Report a problem | ||
| 10/2/2010 | Listed for sale | -- |
Source: foreclosure.com Report a problem | ||
| 9/2/2003 | Sold | $90,900+82%$120/sqft |
Source: Public Record Report a problem | ||
| 5/13/1998 | Sold | $49,950$66/sqft |
Source: Public Record Report a problem | ||
| Year | Property taxes | Tax assessment |
|---|---|---|
| 2026 | $772 +2.9% | $106,880 +2.8% |
| 2025 | $751 -3.7% | $103,980 -2.7% |
| 2024 | $779 +0.3% | $106,880 +0.7% |
| 2023 | $777 +9.4% | $106,120 +9% |
| 2022 | $710 +22.1% | $97,320 +19.1% |
| 2021 | $582 -14.3% | $81,720 +2.4% |
| 2020 | $678 -9.9% | $79,800 -9.9% |
| 2018 | $753 +0.6% | $88,600 +0.6% |
| 2017 | $749 -0.1% | $88,090 -0.1% |
| 2016 | $749 | $88,140 |
| 2015 | $749 -10.8% | $88,140 -10.8% |
| 2014 | $840 -10.1% | $98,780 -10.1% |
| 2013 | $934 +12.5% | $109,850 +12.5% |
| 2012 | $830 | $97,680 |
| 2011 | $830 -30.7% | $97,680 -30.7% |
| 2010 | $1,197 -11% | $140,860 -11% |
| 2009 | $1,345 +51% | $158,230 +56.3% |
| 2007 | $891 -4.3% | $101,220 |
| 2006 | $931 +7.7% | $101,220 +12.4% |
| 2005 | $865 +18.8% | $90,070 +18.8% |
| 2004 | $728 +25% | $75,800 +25% |
| 2003 | $582 +0% | $60,640 |
| 2002 | $582 +184.4% | $60,640 +240.7% |
| 2001 | $205 | $17,800 |
Source: Bright MLS. This data may not be complete. We recommend contacting the local school district to confirm school assignments for this home.

A local agent can set up tours, give advice and negotiate with sellers.