2025/2026 Career Center Home (the 50th!) A partnership with Homebuilders Association & School District 2. Builder is Langlas Construction. We commend the Career Center students, staff and Langlas Construction.
Pending
Price cut: $26K (8/25)
$499,000
3071 Hunters Ridge Loop, Billings, MT 59102
3beds
1,492sqft
Single Family Residence
Built in 2026
-- sqft lot
$-- Zestimate®
$334/sqft
$-- HOA
What's special
- 161 days
- 32
- 0
Zillow last checked:
Listed by:
Myles Egan 406-855-0008,
Floberg Real Estate
Source: BHHS broker feed,MLS#: 359749
Facts & features
Interior
Bedrooms & bathrooms
- Bedrooms: 3
- Bathrooms: 2
- Full bathrooms: 2
Heating
- Forced Air, Natural Gas
Cooling
- Central Air
Appliances
- Included: Dishwasher, Microwave, Refrigerator
Features
- Has basement: No
Interior area
- Total structure area: 1,492
- Total interior livable area: 1,492 sqft
Property
Details
- Parcel number: 03092612268070000
Construction
Type & style
- Home type: SingleFamily
- Property subtype: Single Family Residence
Condition
- Year built: 2026
Community & HOA
Location
- Region: Billings
Financial & listing details
- Price per square foot: $334/sqft
- Tax assessed value: $84,310
- Annual tax amount: $488
- Date on market: 6/2/2026
- Lease term: Contact For Details
Estimated market value
Not available
Estimated sales range
Not available
$2,284/mo
Price history
| Date | Event | Price |
|---|---|---|
| 9/25/2026 | Pending sale | $499,000$334/sqft |
Source: BHHS broker feed #359749 Report a problem | ||
| 8/25/2026 | Price change | $499,000-5%$334/sqft |
Source:  BMTMLS #359749 Report a problem | ||
| 7/23/2026 | Price change | $525,000-4.5%$352/sqft |
Source: BMTMLS #359749 Report a problem | ||
| 6/23/2026 | Price change | $550,000-4.3%$369/sqft |
Source: BMTMLS #359749 Report a problem | ||
| 6/2/2026 | Listed for sale | $575,000$385/sqft |
Source: BMTMLS #359749 Report a problem | ||
Public tax history
| Year | Property taxes | Tax assessment |
|---|---|---|
| 2025 | $488 -39.8% | $84,310 -6.1% |
| 2024 | $812 +1.2% | $89,816 |
| 2023 | $802 +14.7% | $89,816 +27.5% |
| 2022 | $699 +5.1% | $70,459 |
| 2021 | $665 +6.2% | $70,459 +6.3% |
| 2020 | $627 -1.9% | $66,259 |
| 2019 | $639 -12.2% | $66,259 +5.2% |
| 2018 | $727 +2.9% | $62,961 |
| 2017 | $707 +19.9% | $62,961 +20.8% |
| 2016 | $589 | $52,119 |
| 2015 | $589 -10% | $52,119 +60.3% |
| 2014 | $654 +28.8% | $32,523 +6.3% |
| 2013 | $508 +6.4% | $30,586 +7.3% |
| 2012 | $478 | $28,498 |
Find assessor info on the county website
Monthly payment
Est. payment
Payment breakdown
Explore the cost of this home by adjusting the details. Changes won't be saved.Climate risks
Neighborhood: West End
Similar homes
- $419,9004 bd2 ba2.1k sqft2904 Georgina Dr, Billings, MT 59102For Sale
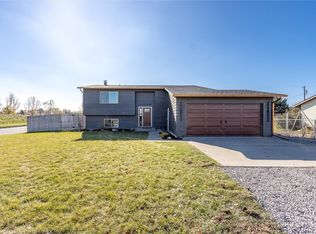
 MLS ID #362585, Brenda Zimmerer, A A A Realty, Inc.. BMTMLS
- $485,0003 bd2 ba1.7k sqft7801 Monad Rd, Billings, MT 59106For Sale
 MLS ID #362614, Hannah Reno, Keller Williams Yellowstone Pr. BMTMLS
- $475,0004 bd3 ba1.7k sqft5421 Corner Stone Ave, Billings, MT 59106For Sale
 MLS ID #362670, Jeff Uhren, Realty Billings. BMTMLS
- from $475,4063 bd2 ba1.6k sqftSundance Plan, 44 West, Billings, MT 59102New Construction
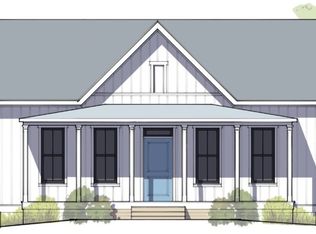 McCall Homes
- $500,0003 bd2 ba1.9k sqft623 Zebra St, Billings, MT 59106For SaleMLS ID #359771, Elizabeth Shumaker, White Lotus Realty. BMTMLS
- $479,0004 bd2 ba2.1k sqft2720 Poly Dr, Billings, MT 59102For SaleMLS ID #361979, Michelle Garton, eXp Realty, LLC - Billings. BMTMLS
- $410,0003 bd3 ba2k sqft1706 Mariposa Ln, Billings, MT 59102For SaleMLS ID #359967, Bill Stene, Metro, REALTORS L.L.P. BMTMLS
- $479,9004 bd2 ba2.1k sqft7928 Cheetah Ave, Billings, MT 59106For SaleMLS ID #361511, Polly Kovash, Metro, REALTORS L.L.P. BMTMLS
- $389,0003 bd2 ba1.2k sqft2411 Patricia Ln, Billings, MT 59102For SaleMLS ID #361489, Brian Lang, Century 21 Americana. BMTMLS
- $418,9005 bd3 ba2.2k sqft2123 Yellowstone Ave, Billings, MT 59102For SaleMLS ID #361952, Jeanette Busony, eXp Realty, LLC - Billings. BMTMLS
- $455,0003 bd2 ba1.6k sqft5238 Amherst Dr, Billings, MT 59106For SaleMLS ID #362196, Lani Gershmel, Real Estate Hub LLLP. BMTMLS
- $429,9003 bd3 ba1.5k sqft1621 Island View Dr, Billings, MT 59101For SaleMLS ID #361667, Brian Huskey, ERA American Real Estate. BMTMLS
- $539,9004 bd2 ba1.9k sqft1938 Hawthorne Ln, Billings, MT 59105For SaleMLS ID #362642, Kierney Nielsen, Realty Billings. BMTMLS
- $385,0005 bd2 ba2k sqft1611 Cook Ave, Billings, MT 59102For SaleMLS ID #362157, Drew Stensland, Real Estate Hub LLLP. BMTMLS
- $339,0003 bd1 ba1.3k sqft1530 Lewis Ave, Billings, MT 59102For SaleMLS ID #361841, Heidi Brosovich, Montana Real Estate Brokers. BMTMLS
- $429,9003 bd2 ba1.3k sqft53 Double Haul Ln, Billings, MT 59106New ConstructionMLS ID #362022, Lauren Johnson, Oakland & Company. BMTMLS
- $599,9003 bd2 ba1.5k sqft6316 Still River Dr, Billings, MT 59106For SaleMLS ID #360810, Billie Kouwenhoven, Real Estate Hub LLLP. BMTMLS
- $339,0003 bd1 ba2.1k sqft2016 Yellowstone Ave, Billings, MT 59102For SaleMLS ID #362425, Callen Kleinhenz, Engel & Voelkers. BMTMLS
