$330,000
3 bd|2 ba|1.3k sqft
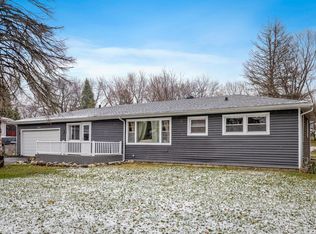
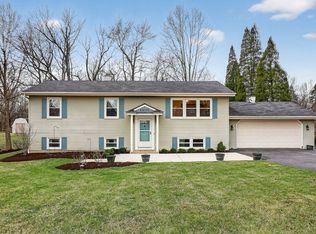
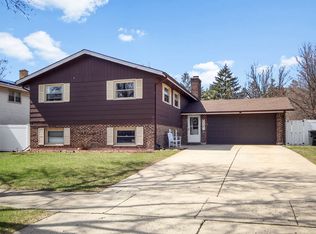
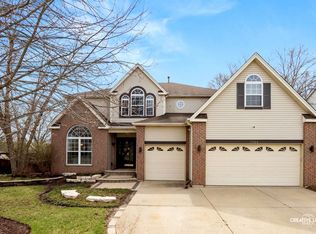
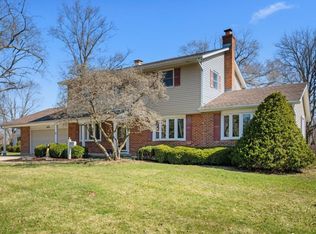
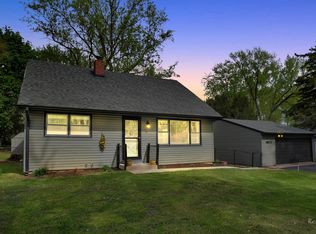
4N211 Kaelin Rd, West Chicago, IL 60185
Sold
Likely to sell faster than
Zillow last checked: 7 hours ago
Listing updated: April 03, 2026 at 08:46pm
Vimi Shukla 630-745-0928,
Coldwell Banker Realty
$509,800
$484,000 - $535,000
$3,873/mo
| Date | Event | Price |
|---|---|---|
| 4/4/2026 | Price change | $519,000-1.1%$193/sqft |
Source: | ||
| 3/12/2026 | Listed for sale | $525,000+10.3%$195/sqft |
Source: | ||
| 6/3/2024 | Listing removed | -- |
Source: | ||
| 5/24/2024 | Listed for sale | $475,900$177/sqft |
Source: | ||
| 5/24/2024 | Listing removed | -- |
Source: | ||
| 5/2/2024 | Listed for sale | $475,900-4.7%$177/sqft |
Source: | ||
| 5/2/2024 | Listing removed | -- |
Source: | ||
| 4/18/2024 | Listed for sale | $499,500-7.5%$186/sqft |
Source: | ||
| 4/18/2024 | Listing removed | -- |
Source: | ||
| 4/3/2024 | Listed for sale | $539,910+73%$201/sqft |
Source: | ||
| 10/11/2023 | Sold | $312,000+1%$116/sqft |
Source: | ||
| 8/15/2023 | Contingent | $309,000$115/sqft |
Source: | ||
| 8/11/2023 | Listed for sale | $309,000$115/sqft |
Source: | ||
| Year | Property taxes | Tax assessment |
|---|---|---|
| 2024 | $9,866 +24.1% | $139,968 +10.2% |
| 2023 | $7,953 -1.9% | $126,990 +7.6% |
| 2022 | $8,105 +3.4% | $118,020 +5.3% |
| 2021 | $7,835 +2.3% | $112,040 +3.1% |
| 2020 | $7,656 +1.4% | $108,680 +3.7% |
| 2019 | $7,549 +1.9% | $104,800 +4.5% |
| 2018 | $7,407 +1.9% | $100,280 +4.2% |
| 2017 | $7,266 +9% | $96,280 +11% |
| 2016 | $6,663 -0.8% | $86,760 +5.6% |
| 2015 | $6,716 +14.3% | $82,130 +7.5% |
| 2014 | $5,876 -16.8% | $76,380 -2.3% |
| 2013 | $7,066 -2.9% | $78,210 -14.5% |
| 2012 | $7,279 +6.4% | $91,480 -7.6% |
| 2011 | $6,841 +5.4% | $98,970 -7.8% |
| 2010 | $6,492 -2.2% | $107,400 -6.4% |
| 2009 | $6,635 +6.1% | $114,760 |
| 2008 | $6,252 +3.9% | $114,760 +5% |
| 2007 | $6,018 +4.2% | $109,300 +9.2% |
| 2006 | $5,775 +4.5% | $100,120 +5.2% |
| 2005 | $5,526 +5.6% | $95,170 +5.7% |
| 2004 | $5,232 +4.3% | $90,040 +8.1% |
| 2003 | $5,016 +21.4% | $83,290 +8% |
| 2002 | $4,131 -4.8% | $77,120 +7.9% |
| 2001 | $4,341 -3% | $71,460 +5.5% |
| 2000 | $4,475 | $67,740 |
Find assessor info on the county website
Source: MRED as distributed by MLS GRID. This data may not be complete. We recommend contacting the local school district to confirm school assignments for this home.