Some homes give you just enough room. 34 Holy Cross Street gives you four bedrooms: one to sleep in, one for the home office, one for guests, and one still waiting for its story. This 1950 East Springfield Cape has 1.5 baths, a well-kept interior, and is ready the day you get the keys. Downstairs, a full basement is open for a workshop, a gym, or extra storage. Saturdays can start at Marshall Roy Park, errands are a short drive to Liberty Plaza, and I-291 and the Mass Pike keep the weekday commute simple. Four bedrooms at an entry-level price don't come up often in this neighborhood, and when they do, they don't last. Book your showing today.
For sale
$289,000
34 Holy Cross St, Springfield, MA 01104
4beds
1,300sqft
Single Family Residence
Built in 1950
5,001 Square Feet Lot
$290,300 Zestimate®
$222/sqft
$-- HOA
What's special
- 7 days
- 426
- 35
Zillow last checked:
Listing updated:
Listed by:
Lucy Cordero 413-454-8540,
Keller Williams Realty 860-313-0700
Source: MLS PIN,MLS#: 73602176
Facts & features
Interior
Bedrooms & bathrooms
- Bedrooms: 4
- Bathrooms: 2
- Full bathrooms: 1
- 1/2 bathrooms: 1
Heating
- Electric
Cooling
- None
Features
- Basement: Full,Partially Finished
- Has fireplace: No
Interior area
- Total structure area: 1,300
- Total interior livable area: 1,300 sqft
- Finished area above ground: 1,300
Property
Parking
- Total spaces: 2
- Parking features: Paved Drive
- Uncovered spaces: 2
Lot
- Size: 5,001 Square Feet
Details
- Parcel number: 2588771
- Zoning: R2
Construction
Type & style
- Home type: SingleFamily
- Architectural style: Cape
- Property subtype: Single Family Residence
Materials
- Frame
- Foundation: Block
- Roof: Shingle
Condition
- Year built: 1950
Utilities & green energy
- Sewer: Public Sewer
- Water: Public
Community & HOA
HOA
- Has HOA: No
Location
- Region: Springfield
Financial & listing details
- Price per square foot: $222/sqft
- Tax assessed value: $279,900
- Annual tax amount: $4,327
- Date on market: 11/13/2026
Estimated market value
$290,300
$276,000 - $305,000
$2,835/mo
Price history
| Date | Event | Price |
|---|---|---|
| 11/14/2026 | Listed for sale | $289,000+133.1%$222/sqft |
Source: MLS PIN #73602176 Report a problem | ||
| 10/3/2018 | Sold | $124,000-3.9%$95/sqft |
Source: Public Record Report a problem | ||
| 8/20/2018 | Pending sale | $129,000$99/sqft |
Source: Maria Acuna Real Estate #72358676 Report a problem | ||
| 7/30/2018 | Price change | $129,000-7.2%$99/sqft |
Source: Maria Acuna Real Estate #72358676 Report a problem | ||
| 7/9/2018 | Listed for sale | $139,000+41.8%$107/sqft |
Source: Maria Acuna Real Estate #72358676 Report a problem | ||
| 5/30/2008 | Sold | $98,000$75/sqft |
Source: Public Record Report a problem | ||
Public tax history
| Year | Property taxes | Tax assessment |
|---|---|---|
| 2025 | $3,704 +3.8% | $236,200 +6.3% |
| 2024 | $3,569 +2.4% | $222,200 +8.7% |
| 2023 | $3,485 +18.3% | $204,400 +30.6% |
| 2022 | $2,945 -2.3% | $156,500 -1.8% |
| 2021 | $3,013 -0.5% | $159,400 +6.4% |
| 2020 | $3,030 +16% | $149,800 +12.9% |
| 2019 | $2,612 +12.5% | $132,700 +12.5% |
| 2018 | $2,322 +4.8% | $118,000 +4.7% |
| 2017 | $2,216 +3.1% | $112,700 +3.1% |
| 2016 | $2,149 +5.3% | $109,300 +5.4% |
| 2015 | $2,040 -2.3% | $103,700 -2.2% |
| 2014 | $2,089 +15.9% | $106,000 +15.8% |
| 2013 | $1,803 -19% | $91,500 -18.4% |
| 2012 | $2,225 +0.8% | $112,200 -1% |
| 2011 | $2,208 +20.5% | $113,300 +20.5% |
| 2010 | $1,833 -3.8% | $94,000 -11.7% |
| 2009 | $1,905 -0.8% | $106,500 -11.1% |
| 2008 | $1,920 -5.7% | $119,800 -5.7% |
| 2007 | $2,037 +10.3% | $127,000 +16.9% |
| 2006 | $1,846 +7.5% | $108,600 +10.7% |
| 2005 | $1,718 +12% | $98,100 +21.4% |
| 2004 | $1,534 +2.6% | $80,800 +4.9% |
| 2003 | $1,495 +9.6% | $77,000 +12.2% |
| 2002 | $1,364 | $68,600 |
Find assessor info on the county website
Monthly payment
Est. payment
Payment breakdown
Explore the cost of this home by adjusting the details. Changes won't be saved.Climate risks
Neighborhood: East Springfield

Similar homes
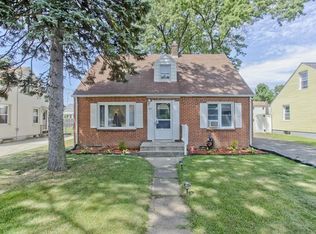
- $309,9004 bd2 ba1.6k sqft68 Monrovia St, Springfield, MA 01104For Sale
 MLS ID #73602781, Dawn Rodgers, Dot Lortie Realty / Landmark. MLS PIN
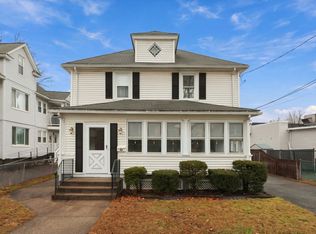
- $319,0003 bd1 ba1.2k sqft62 Redlands St, Springfield, MA 01104For Sale
 MLS ID #73603435, Amy Simmons, Cornerstone Realty, LLC. MLS PIN
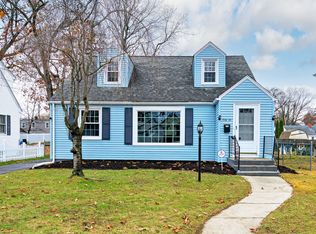
- $298,9004 bd1 ba1.2k sqft7 Campechi St, Springfield, MA 01104For Sale
 MLS ID #73595685, Lisa Berry, Simply Sell Realty. MLS PIN
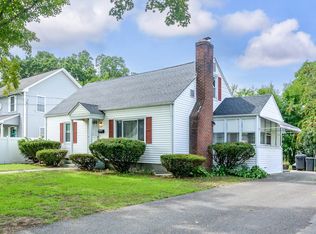
- $319,9004 bd2 ba1.4k sqft44 Arthur St, Springfield, MA 01104For Sale
 MLS ID #73577227, Natasha Figueroa, Homes Logic Real Estate, LLC. MLS PIN
