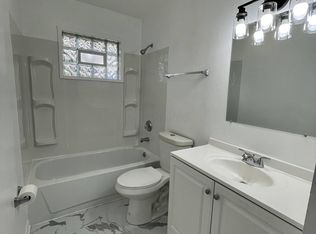
Calling all investors! This 1-story home offers 3 bedrooms, 1 full bathroom, and 891 square feet of living space. Situated on a 7,405-square-foot lot, the property offers plenty of potential for updates and improvements. Bring your vision and transform this home into your next investment or renovation project. Schedule your showing today!
For sale
$179,900
3483 Penfield Rd, Columbus, OH 43227
3beds
891sqft
Single Family Residence
Built in 1966
7,405 Square Feet Lot
$-- Zestimate®
$202/sqft
$-- HOA
What's special
- 19 days
- 147
- 12
Zillow last checked:
Listing updated:
Listed by:
Eva Marie Hockenberry 704-859-2176,
Mainstay Brokerage LLC
Source: Columbus and Central Ohio Regional MLS ,MLS#: 226039008
Facts & features
Interior
Bedrooms & bathrooms
- Bedrooms: 3
- Bathrooms: 1
- Full bathrooms: 1
- Main level bedrooms: 3
Features
- Basement: Partial
- Common walls with other units/homes: No Common Walls
Interior area
- Total structure area: 891
- Total interior livable area: 891 sqft
Property
Features
- Levels: One
Lot
- Size: 7,405 Square Feet
Details
- Parcel number: 010141468
Construction
Type & style
- Home type: SingleFamily
- Architectural style: Ranch
- Property subtype: Single Family Residence
Materials
- Foundation: Slab
Condition
- New construction: No
- Year built: 1966
Utilities & green energy
- Sewer: Public Sewer
- Water: Public
Community & HOA
Community
- Subdivision: PENFIELD
HOA
- Has HOA: No
Location
- Region: Columbus
Financial & listing details
- Price per square foot: $202/sqft
- Tax assessed value: $125,100
- Annual tax amount: $2,013
- Date on market: 10/14/2026
- Listing terms: Conventional
Estimated market value
Not available
Estimated sales range
Not available
Not available
Price history
| Date | Event | Price |
|---|---|---|
| 10/14/2026 | Listed for sale | $179,900+230.1%$202/sqft |
Source:  Columbus and Central Ohio Regional MLS #226039008 Report a problem | ||
| 4/30/2025 | Listing removed | $1,325$1/sqft |
Source: Zillow Rentals Report a problem | ||
| 4/25/2025 | Listed for rent | $1,325$1/sqft |
Source: Zillow Rentals Report a problem | ||
| 4/16/2025 | Listing removed | $1,325$1/sqft |
Source: Zillow Rentals Report a problem | ||
| 4/4/2025 | Listed for rent | $1,325+33.8%$1/sqft |
Source: Zillow Rentals Report a problem | ||
| 3/23/2020 | Listing removed | $990$1/sqft |
Source: Vinebrook Homes Report a problem | ||
| 3/18/2020 | Listed for rent | $990$1/sqft |
Source: Vinebrook Homes Report a problem | ||
| 10/5/2015 | Sold | $54,500+202.8%$61/sqft |
Source: Columbus and Central Ohio Regional MLS #215033115 Report a problem | ||
| 7/18/2011 | Sold | $18,000-7.7%$20/sqft |
Source: Public Record Report a problem | ||
| 3/23/2009 | Sold | $19,500-34.8%$22/sqft |
Source: Public Record Report a problem | ||
| 2/7/2009 | Listed for sale | $29,900-41.4%$34/sqft |
Source: Postlets Report a problem | ||
| 1/13/2009 | Listing removed | $51,000$57/sqft |
Source: NCI #2830585 Report a problem | ||
| 9/16/2008 | Listed for sale | $51,000$57/sqft |
Source: NCI #2830585 Report a problem | ||
Public tax history
| Year | Property taxes | Tax assessment |
|---|---|---|
| 2025 | $2,013 +0.3% | $43,790 |
| 2024 | $2,007 +1.3% | $43,790 |
| 2023 | $1,982 +54.9% | $43,790 +81.9% |
| 2022 | $1,280 -0.2% | $24,080 |
| 2021 | $1,282 -0.1% | $24,080 |
| 2020 | $1,284 +4% | $24,080 +21.3% |
| 2019 | $1,234 +0.2% | $19,850 |
| 2018 | $1,232 | $19,850 |
| 2017 | $1,232 +16.4% | $19,850 +27.4% |
| 2016 | $1,058 +9.8% | $15,580 |
| 2015 | $964 | $15,580 |
| 2014 | $964 +82.1% | $15,580 -9.9% |
| 2013 | $529 -48.9% | $17,290 |
| 2011 | $1,035 -31.3% | $17,290 -30.3% |
| 2010 | $1,506 +8.1% | $24,815 |
| 2008 | $1,393 +138.3% | $24,815 |
| 2007 | $585 +0.7% | -- |
| 2006 | $581 +5.1% | -- |
| 2005 | $552 -16.1% | -- |
| 2004 | $659 +25.6% | -- |
| 2003 | $524 -2.7% | -- |
| 2002 | $539 +24.2% | -- |
| 2001 | $434 -0.9% | -- |
| 2000 | $438 | -- |
Find assessor info on the county website
Monthly payment
Est. payment
Payment breakdown
Explore the cost of this home by adjusting the details. Changes won't be saved.Climate risks
Neighborhood: Linwood

Similar homes
- $185,0003 bd2 ba1k sqft4781 E Livingston Ave, Columbus, OH 43227For Sale By Owner

- $175,0003 bd1 ba993 sqft2094 Wadsworth Dr, Columbus, OH 43232For Sale
 MLS ID #226041357, Aaron J McDaniel, Mainstream Realty Pros. Columbus and Central Ohio Regional MLS
- $199,0002 bd2 ba1k sqft1075 Beechwood Rd, Columbus, OH 43227For Sale
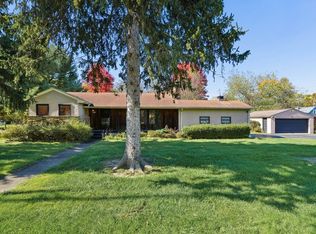 MLS ID #226041470, Danielle Y Alexander, Coldwell Banker Realty. Columbus and Central Ohio Regional MLS
- $193,0003 bd1 ba896 sqft3440 Binbrook Rd N, Columbus, OH 43227For Sale
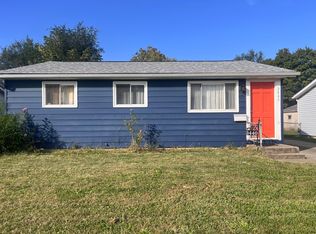 MLS ID #226038592, Johanna A Haynes, Plum Tree Realty. Columbus and Central Ohio Regional MLS
- $182,5003 bd2 ba984 sqft1461 Courtright Rd, Columbus, OH 43227For SaleMLS ID #226035536, Brandon Thompson, Red 1 Realty. Columbus and Central Ohio Regional MLS
- $169,9003 bd2 ba1.1k sqft1688 Penfield Rd, Columbus, OH 43227For SaleMLS ID #226035319, Krista L Mathers, NextHome Experience. Columbus and Central Ohio Regional MLS
- $169,9003 bd1 ba1.2k sqft1483 Courtright Rd, Columbus, OH 43227For SaleMLS ID #226038135, Richard Freeman, Coldwell Banker Realty. Columbus and Central Ohio Regional MLS
- $194,9003 bd2 ba1.2k sqft3426 Seabrook Ave, Columbus, OH 43227For SaleMLS ID #226039167, Eva Marie Hockenberry, Mainstay Brokerage LLC. Columbus and Central Ohio Regional MLS
- $185,0003 bd1 ba900 sqft1272 Carolwood Ave, Columbus, OH 43227For SaleMLS ID #226036698, Crystal McCaster, Vylla Home. Columbus and Central Ohio Regional MLS
- $184,9003 bd1 ba950 sqft1656 Vilardo Ln, Columbus, OH 43227For SaleMLS ID #226021862, Yanzhou Niu, OwnerLand Realty, Inc.. Columbus and Central Ohio Regional MLS
- $215,0003 bd1 ba1k sqft1437 Vilardo Ln, Columbus, OH 43227For SaleMLS ID #226040409, Kimberly Klenk, EXP Realty, LLC. Columbus and Central Ohio Regional MLS
- $159,9003 bd1 ba838 sqft2378 Millerton St, Columbus, OH 43232For SaleMLS ID #226040899, Eva Marie Hockenberry, Mainstay Brokerage LLC. Columbus and Central Ohio Regional MLS
- $189,9003 bd1 ba1.2k sqft3599 Astor Ave, Columbus, OH 43227For SaleMLS ID #226032135, Adam D. Woodring, Mainstay Brokerage LLC. Columbus and Central Ohio Regional MLS
- $164,9003 bd1 ba1.1k sqft835 S Hampton Rd, Columbus, OH 43227For SaleMLS ID #226038589, Adam D. Woodring, Mainstay Brokerage LLC. Columbus and Central Ohio Regional MLS
- $196,5003 bd1 ba1.3k sqft1148 Beechwood Rd, Columbus, OH 43227For SaleMLS ID #226038644, Paul F Hunt, Howard Hanna Real Estate Svcs. Columbus and Central Ohio Regional MLS
- $179,9003 bd1 ba1.1k sqft3426 Bruceton Ave, Columbus, OH 43232For SaleMLS ID #226038243, Chanston Moll, Key Realty. Columbus and Central Ohio Regional MLS
- $179,9004 bd2 ba1.2k sqft4941 Betsy Dr, Columbus, OH 43227For SaleMLS ID #226032550, Erik Hiss, Keller Williams Capital Ptnrs. Columbus and Central Ohio Regional MLS
- $184,9002 bd1 ba865 sqft1303 Elderwood Ave, Columbus, OH 43227For SaleMLS ID #226019484, Kip L Rooks, Coldwell Banker Realty. Columbus and Central Ohio Regional MLS
