Welcome to this Cape Cod offering 3 bedrooms, 1 full bathroom, and 1,182 square feet of above-grade living space. The home features a cozy fireplace, partially finished attic space, and a full basement providing additional storage and flexibility. With a functional floor plan and opportunities to add your own updates and personal touches, this home has plenty of potential. Schedule your showing today!
For sale
$164,900
835 S Hampton Rd, Columbus, OH 43227
3beds
1,182sqft
Single Family Residence
Built in 1956
5,227 Square Feet Lot
$-- Zestimate®
$140/sqft
$-- HOA
What's special
Functional floor planPartially finished attic spaceCozy fireplace
- 11 days
- 167
- 10
Zillow last checked:
Listing updated:
Listed by:
Adam D. Woodring 615-931-2491,
Mainstay Brokerage LLC
Source: Columbus and Central Ohio Regional MLS ,MLS#: 226038589
Facts & features
Interior
Bedrooms & bathrooms
- Bedrooms: 3
- Bathrooms: 1
- Full bathrooms: 1
- Main level bedrooms: 3
Cooling
- Central Air
Appliances
- Included: Electric Range
Features
- Basement: Full
- Common walls with other units/homes: No Common Walls
Interior area
- Total structure area: 1,182
- Total interior livable area: 1,182 sqft
Property
Parking
- Parking features: On Street
- Has uncovered spaces: Yes
Features
- Levels: One
Lot
- Size: 5,227 Square Feet
Details
- Parcel number: 010088721
Construction
Type & style
- Home type: SingleFamily
- Architectural style: Cape Cod
- Property subtype: Single Family Residence
Materials
- Foundation: Block
Condition
- New construction: No
- Year built: 1956
Utilities & green energy
- Sewer: Public Sewer
- Water: Public
Community & HOA
HOA
- Has HOA: No
Location
- Region: Columbus
Financial & listing details
- Price per square foot: $140/sqft
- Tax assessed value: $146,600
- Annual tax amount: $2,359
- Date on market: 10/9/2026
- Listing terms: Other,VA Loan,FHA,Conventional
Estimated market value
Not available
Estimated sales range
Not available
Not available
Price history
| Date | Event | Price |
|---|---|---|
| 10/9/2026 | Listed for sale | $164,900+75.4%$140/sqft |
Source:  Columbus and Central Ohio Regional MLS #226038589 Report a problem | ||
| 3/16/2024 | Listing removed | -- |
Source: Zillow Rentals Report a problem | ||
| 2/15/2024 | Listed for rent | $1,200$1/sqft |
Source: Zillow Rentals Report a problem | ||
| 10/15/2020 | Sold | $94,000+110.8%$80/sqft |
Source: Columbus and Central Ohio Regional MLS #220022184 Report a problem | ||
| 10/30/2019 | Listing removed | $1,200$1/sqft |
Source: JPM Real Estate Services LLC Report a problem | ||
| 10/14/2019 | Listed for rent | $1,200$1/sqft |
Source: JPM Real Estate Services LLC Report a problem | ||
| 1/31/2003 | Sold | $44,600-27.5%$38/sqft |
Source: Public Record Report a problem | ||
| 5/1/1996 | Sold | $61,500$52/sqft |
Source: Public Record Report a problem | ||
Public tax history
| Year | Property taxes | Tax assessment |
|---|---|---|
| 2025 | $2,359 +0.3% | $51,310 |
| 2024 | $2,351 +1.3% | $51,310 |
| 2023 | $2,322 +86.6% | $51,310 +119.1% |
| 2022 | $1,245 -0.2% | $23,420 |
| 2021 | $1,247 -0.1% | $23,420 |
| 2020 | $1,249 +7.8% | $23,420 +25.7% |
| 2019 | $1,158 +0.2% | $18,630 |
| 2018 | $1,157 | $18,630 |
| 2017 | $1,157 -20.8% | $18,630 -13.3% |
| 2016 | $1,461 +9.8% | $21,500 |
| 2015 | $1,330 | $21,500 |
| 2014 | $1,330 +82.1% | $21,500 -9.9% |
| 2013 | $730 -48.9% | $23,870 |
| 2011 | $1,429 -11.6% | $23,870 -15.9% |
| 2010 | $1,616 +6.4% | $28,385 |
| 2008 | $1,519 +22.1% | $28,385 |
| 2007 | $1,244 +0.4% | -- |
| 2006 | $1,239 +4.2% | -- |
| 2005 | $1,189 -0.9% | -- |
| 2004 | $1,200 +11% | -- |
| 2003 | $1,080 +8.6% | -- |
| 2002 | $995 +7.9% | -- |
| 2001 | $922 -0.5% | -- |
| 2000 | $926 | -- |
Find assessor info on the county website
Monthly payment
Est. payment
Payment breakdown
Explore the cost of this home by adjusting the details. Changes won't be saved.Climate risks
Neighborhood: Eastmoor


Similar homes
- $165,0004 bd1 ba1k sqft859 Ruby Ave, Columbus, OH 43227For Sale
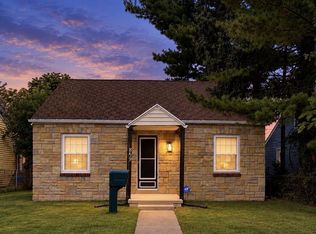 MLS ID #20101132, Brittany Anderson. MAR
- $165,0003 bd1 ba1k sqft864 S Waverly St, Columbus, OH 43227For Sale
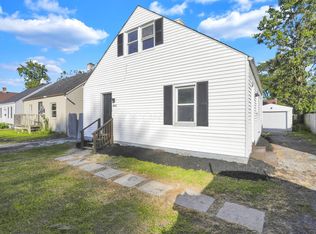
 MLS ID #226037040, Dylan J Knecht, RE/MAX Revealty. Columbus and Central Ohio Regional MLS
- $169,9003 bd2 ba1.1k sqft1688 Penfield Rd, Columbus, OH 43227For Sale
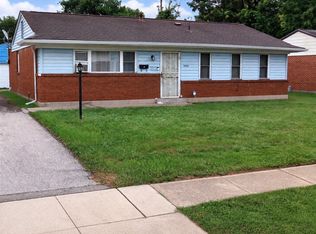 MLS ID #226035319, Krista L Mathers, NextHome Experience. Columbus and Central Ohio Regional MLS
- $--4 bd2 ba1k sqft765 Elizabeth Ave, Columbus, OH 43227Auction
 Auction.com 1
- $179,9003 bd1 ba891 sqft3483 Penfield Rd, Columbus, OH 43227For SaleMLS ID #226039008, Michael Mcgee, Mainstay Brokerage LLC. Columbus and Central Ohio Regional MLS
- $175,9003 bd1 ba1.2k sqft1483 Courtright Rd, Columbus, OH 43227For SaleMLS ID #226038135, Richard Freeman, Coldwell Banker Realty. Columbus and Central Ohio Regional MLS
- $194,9003 bd2 ba1.2k sqft3426 Seabrook Ave, Columbus, OH 43227For SaleMLS ID #226039167, Michael Mcgee, Mainstay Brokerage LLC. Columbus and Central Ohio Regional MLS
- $175,0004 bd1 ba1.5k sqft849 Ruby Ave, Columbus, OH 43227For SaleMLS ID #226029985, Lee Ritchie, RE/MAX Partners. Columbus and Central Ohio Regional MLS
- $159,9003 bd1 ba971 sqft595 S Waverly St, Columbus, OH 43213For SaleMLS ID #226038392, Mark D Corbin, NextHome Experience. Columbus and Central Ohio Regional MLS
- $239,9003 bd2 ba1k sqft3314 Towers Ct N, Columbus, OH 43227For SaleMLS ID #226039755, Evgeniia Belman, Reafco. Columbus and Central Ohio Regional MLS
- $196,5003 bd1 ba1.3k sqft1148 Beechwood Rd, Columbus, OH 43227For SaleMLS ID #226038644, Paul F Hunt, Howard Hanna Real Estate Svcs. Columbus and Central Ohio Regional MLS
- $199,9003 bd1 ba1k sqft1162 Striebel Rd, Columbus, OH 43227For SaleMLS ID #226038511, Nicholas Donofrio, Red 1 Realty. Columbus and Central Ohio Regional MLS
- $182,5003 bd2 ba984 sqft1461 Courtright Rd, Columbus, OH 43227For SaleMLS ID #226035536, Brandon Thompson, Red 1 Realty. Columbus and Central Ohio Regional MLS
- $194,9003 bd1 ba1.2k sqft3599 Astor Ave, Columbus, OH 43227For SaleMLS ID #226032135, Adam D. Woodring, Mainstay Brokerage LLC. Columbus and Central Ohio Regional MLS
- $199,0003 bd1 ba896 sqft3440 Binbrook Rd N, Columbus, OH 43227For SaleMLS ID #226038592, Johanna A Haynes, Plum Tree Realty. Columbus and Central Ohio Regional MLS
- $144,9003 bd1 ba912 sqft1731 Burlington Ave, Columbus, OH 43227For SaleMLS ID #226033468, Michael Mcgee, Mainstay Brokerage LLC. Columbus and Central Ohio Regional MLS
- $199,9993 bd1 ba840 sqft4307 Conover Pl, Columbus, OH 43227For SaleMLS ID #226038138, Sherry L Looney, Howard HannaRealEstateServices. Columbus and Central Ohio Regional MLS
