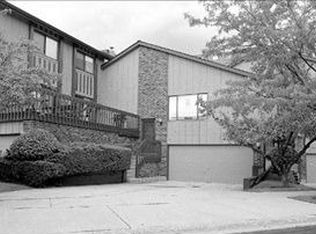
$344,000
2 bd|2 ba|1.2k sqft
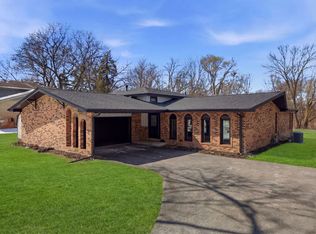
38 Portwine Rd, Willowbrook, IL 60527
Off Market
Zillow last checked: 7 hours ago
Listing updated: February 10, 2026 at 10:07pm
Arvind Aggarwal 630-728-6712,
Charles Rutenberg Realty of IL
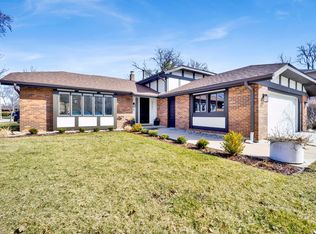
$533,900
$507,000 - $561,000
$3,202/mo
| Date | Event | Price |
|---|---|---|
| 2/6/2026 | Listed for sale | $549,000$268/sqft |
Source: | ||
| 1/1/2026 | Listing removed | $549,000$268/sqft |
Source: | ||
| 7/27/2025 | Listed for sale | $549,000-5.2%$268/sqft |
Source: | ||
| 7/25/2025 | Listing removed | $579,000$283/sqft |
Source: | ||
| 7/16/2025 | Price change | $579,000-1.7%$283/sqft |
Source: | ||
| 7/1/2025 | Price change | $589,000-1.8%$288/sqft |
Source: | ||
| 6/19/2025 | Listed for sale | $599,900+0%$293/sqft |
Source: | ||
| 6/19/2025 | Listing removed | $599,800$293/sqft |
Source: | ||
| 6/14/2025 | Price change | $599,8000%$293/sqft |
Source: | ||
| 5/21/2025 | Listed for sale | $599,900+50.4%$293/sqft |
Source: | ||
| 2/13/2025 | Listing removed | $399,000$195/sqft |
Source: | ||
| 12/30/2024 | Listing removed | $2,850$1/sqft |
Source: MRED as distributed by MLS GRID #12186775 Report a problem | ||
| 11/13/2024 | Listed for sale | $399,000+22.8%$195/sqft |
Source: | ||
| 11/11/2024 | Price change | $2,850-1.6%$1/sqft |
Source: MRED as distributed by MLS GRID #12186775 Report a problem | ||
| 10/25/2024 | Price change | $2,895-1.9%$1/sqft |
Source: MRED as distributed by MLS GRID #12186775 Report a problem | ||
| 10/11/2024 | Listed for rent | $2,950$1/sqft |
Source: MRED as distributed by MLS GRID #12186775 Report a problem | ||
| 10/10/2024 | Sold | $325,000-9.7%$159/sqft |
Source: | ||
| 10/1/2024 | Listing removed | $2,950$1/sqft |
Source: MRED as distributed by MLS GRID #12144357 Report a problem | ||
| 9/30/2024 | Contingent | $359,900$176/sqft |
Source: | ||
| 9/27/2024 | Price change | $359,900-2.7%$176/sqft |
Source: | ||
| 9/11/2024 | Price change | $369,900-2.6%$181/sqft |
Source: | ||
| 8/29/2024 | Price change | $379,900-5%$186/sqft |
Source: | ||
| 8/25/2024 | Price change | $2,950-9.2%$1/sqft |
Source: MRED as distributed by MLS GRID #12144357 Report a problem | ||
| 8/21/2024 | Listed for rent | $3,250$2/sqft |
Source: MRED as distributed by MLS GRID #12144357 Report a problem | ||
| 8/21/2024 | Price change | $399,900-2.4%$195/sqft |
Source: | ||
| 8/15/2024 | Listed for sale | $409,900+82.2%$200/sqft |
Source: | ||
| 4/4/2012 | Sold | $225,000+14.8%$110/sqft |
Source: | ||
| 7/6/1998 | Sold | $196,000$96/sqft |
Source: Public Record Report a problem | ||
| Year | Property taxes | Tax assessment |
|---|---|---|
| 2024 | $7,179 +3.9% | $129,242 +8.8% |
| 2023 | $6,910 +10.9% | $118,810 +11.1% |
| 2022 | $6,232 +3.8% | $106,930 +1.2% |
| 2021 | $6,003 +1.6% | $105,710 +2% |
| 2020 | $5,907 +3.6% | $103,620 |
| 2019 | $5,701 +8.6% | -- |
| 2018 | $5,251 +4.1% | $92,910 +3.9% |
| 2017 | $5,045 +2.6% | $89,400 +4.8% |
| 2016 | $4,919 +5.2% | $85,320 +10.1% |
| 2015 | $4,675 +8.1% | $77,500 +7.5% |
| 2014 | $4,324 +3% | $72,100 +0.5% |
| 2013 | $4,200 +1.7% | $71,760 -4.3% |
| 2012 | $4,129 -3.8% | $74,990 -13.2% |
| 2011 | $4,295 -13.7% | $86,440 -19.9% |
| 2010 | $4,976 +2.6% | $107,850 -5.8% |
| 2009 | $4,849 +0.8% | $114,480 |
| 2008 | $4,811 +3.8% | $114,480 +5.9% |
| 2007 | $4,634 +5% | $108,100 +5% |
| 2006 | $4,414 +7% | $102,950 +7.7% |
| 2005 | $4,127 +4.5% | $95,590 +7% |
| 2004 | $3,947 +4.6% | $89,340 +10% |
| 2003 | $3,775 +5.2% | $81,220 +1.7% |
| 2002 | $3,589 +1.7% | $79,870 +6.8% |
| 2001 | $3,529 +9% | $74,810 +3.5% |
| 2000 | $3,238 | $72,280 |
Source: MRED as distributed by MLS GRID. This data may not be complete. We recommend contacting the local school district to confirm school assignments for this home.