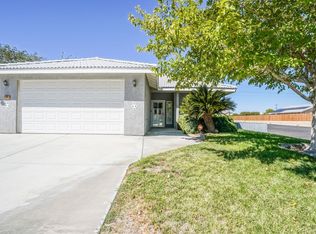
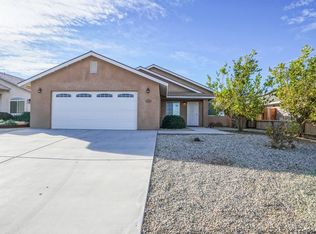
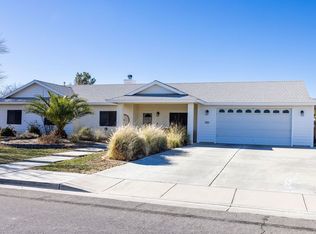
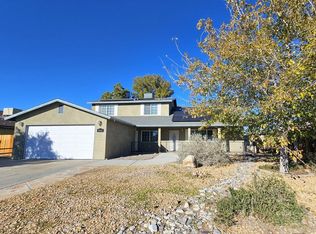
This 2066 square foot single family home has 4 bedrooms and 2.0 bathrooms. This home is located at 400 Mavis Ct, Ridgecrest, CA 93555.
Pre-foreclosure
Est. $369,500
400 Mavis Ct, Ridgecrest, CA 93555
4beds
2baths
2,066sqft
SingleFamily
Built in 2006
6,534 Square Feet Lot
$369,500 Zestimate®
$179/sqft
$-- HOA
Overview
- 94 days |
- 29 |
- 1 |
Facts & features
Interior
Bedrooms & bathrooms
- Bedrooms: 4
- Bathrooms: 2
Heating
- Solar
Cooling
- None
Features
- Has fireplace: Yes
Interior area
- Total interior livable area: 2,066 sqft
Property
Parking
- Total spaces: 2
- Parking features: Garage - Attached
Features
- Exterior features: Stucco, Wood
- Has view: Yes
- View description: Mountain
Lot
- Size: 6,534 Square Feet
Details
- Parcel number: 50918001
Construction
Type & style
- Home type: SingleFamily
Materials
- wood frame
- Roof: Composition
Condition
- Year built: 2006
Community & HOA
Location
- Region: Ridgecrest
Financial & listing details
- Price per square foot: $179/sqft
- Tax assessed value: $362,614
- Annual tax amount: $4,677
Visit our professional directory to find a foreclosure specialist in your area that can help with your home search.
Find a foreclosure agentForeclosure details
Estimated market value
$369,500
$351,000 - $388,000
$2,144/mo
Price history
Price history
| Date | Event | Price |
|---|---|---|
| 10/15/2025 | Listing removed | $375,000$182/sqft |
Source: | ||
| 4/17/2025 | Listed for sale | $375,000-3.6%$182/sqft |
Source: | ||
| 6/12/2024 | Listing removed | $389,000-2.5%$188/sqft |
Source: | ||
| 4/2/2024 | Listed for sale | $399,000+7.3%$193/sqft |
Source: | ||
| 2/3/2023 | Listing removed | -- |
Source: Zillow Rentals Report a problem | ||
| 1/10/2023 | Price change | $1,695-5.6%$1/sqft |
Source: Zillow Rentals Report a problem | ||
| 1/9/2023 | Price change | $1,795-5.5%$1/sqft |
Source: Zillow Rentals Report a problem | ||
| 10/18/2022 | Price change | $1,900-13.6%$1/sqft |
Source: | ||
| 9/23/2022 | Listed for rent | $2,200$1/sqft |
Source: | ||
| 9/22/2022 | Listing removed | -- |
Source: | ||
| 7/6/2022 | Price change | $372,000-2.1%$180/sqft |
Source: | ||
| 5/13/2022 | Listed for sale | $380,000+13.4%$184/sqft |
Source: | ||
| 4/8/2021 | Sold | $335,000$162/sqft |
Source: | ||
| 4/7/2021 | Pending sale | $335,000$162/sqft |
Source: | ||
| 2/4/2021 | Listed for sale | $335,000+9.8%$162/sqft |
Source: Coldwell Banker Best Realty #2600159 Report a problem | ||
| 3/1/2011 | Listing removed | $305,000$148/sqft |
Source: RealEstateShows.com Report a problem | ||
| 2/23/2011 | Listed for sale | $305,000+38.6%$148/sqft |
Source: RealEstateShows.com Report a problem | ||
| 12/23/2010 | Sold | $220,000-4.3%$106/sqft |
Source: Public Record Report a problem | ||
| 11/29/2010 | Pending sale | $229,900$111/sqft |
Source: Fannie Mae Report a problem | ||
| 11/15/2010 | Price change | $229,900-10.4%$111/sqft |
Source: Fannie Mae Report a problem | ||
| 10/14/2010 | Price change | $256,500-7.9%$124/sqft |
Source: Fannie Mae Report a problem | ||
| 10/8/2010 | Price change | $278,400+4.3%$135/sqft |
Source: Fannie Mae Report a problem | ||
| 9/30/2010 | Price change | $266,900-4.1%$129/sqft |
Source: Fannie Mae Report a problem | ||
| 9/27/2010 | Price change | $278,400-8.7%$135/sqft |
Source: Fannie Mae Report a problem | ||
| 9/11/2010 | Listed for sale | $305,000+58.5%$148/sqft |
Source: Fannie Mae Report a problem | ||
| 9/7/2010 | Sold | $192,400-41.9%$93/sqft |
Source: Public Record Report a problem | ||
| 10/9/2006 | Sold | $331,000$160/sqft |
Source: Public Record Report a problem | ||
Public tax history
Public tax history
| Year | Property taxes | Tax assessment |
|---|---|---|
| 2025 | $4,677 +6.4% | $362,614 +2% |
| 2024 | $4,394 +3.2% | $355,504 +2% |
| 2023 | $4,260 +2.1% | $348,534 +2% |
| 2022 | $4,173 | $341,700 +31.2% |
| 2021 | -- | $260,388 +1% |
| 2020 | $3,191 +1.8% | $257,719 |
| 2019 | $3,135 +2% | $257,719 +4% |
| 2018 | $3,074 +0.4% | $247,713 +2% |
| 2017 | $3,063 +10.7% | $242,857 +9.4% |
| 2016 | $2,766 +22.1% | $222,000 +26.1% |
| 2015 | $2,266 -12.9% | $176,000 -19.3% |
| 2014 | $2,600 | $218,000 -3.5% |
| 2013 | -- | $226,000 +1.3% |
| 2012 | $2,506 -1.6% | $223,157 +1.4% |
| 2011 | $2,546 -15.5% | $220,000 -16.8% |
| 2010 | $3,015 -3.1% | $264,269 -3.9% |
| 2009 | $3,111 +1% | $275,000 |
| 2008 | $3,080 -16% | $275,000 -16.9% |
| 2007 | $3,667 +6512.9% | $331,000 +6151.2% |
| 2006 | $55 +5.8% | $5,295 +2% |
| 2005 | $52 +2% | $5,192 |
| 2004 | $51 +4.8% | $5,192 +1.9% |
| 2003 | $49 -60.4% | $5,097 -58.8% |
| 2002 | $124 +2% | $12,368 +2% |
| 2001 | $121 | $12,126 |
| 2000 | -- | $12,126 |
Find assessor info on the county website
BuyAbility℠ payment
Estimated monthly payment
Boost your down payment with 6% savings match
Earn up to a 6% match & get a competitive APY with a *. Zillow has partnered with to help get you home faster.
Learn more*Terms apply. Match provided by Foyer. Account offered by Pacific West Bank, Member FDIC.Climate risks
Neighborhood: 93555
Nearby schools
GreatSchools rating
- 7/10Inyokern Elementary SchoolGrades: K-5Distance: 8.2 mi
- 2/10James Monroe Middle SchoolGrades: 6-8Distance: 1 mi
- 7/10Burroughs High SchoolGrades: 9-12Distance: 2.4 mi