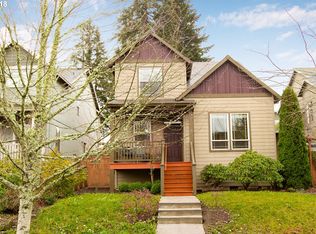
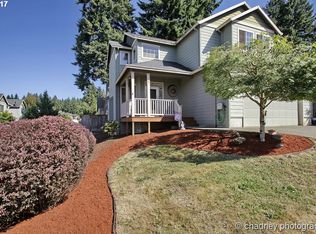
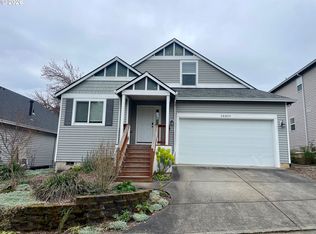
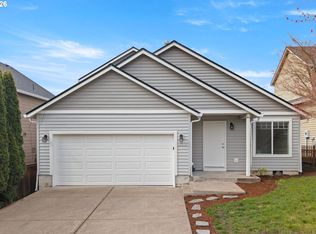
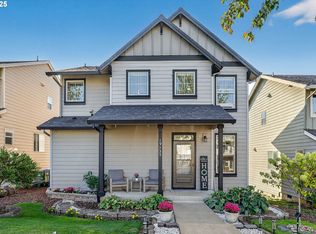
Come see this beautiful 3 bdrm, 2.5 bath home with a main floor bonus/office, large kitchen island peninsula with new SS appliances and ample cabinets, great for entertaining. Open concept great room w/fireplace. New washer, dryer and refrigerator to stay, new water heater in 2022. Hurry this won't last long!!
Pre-foreclosure
Est. $445,200
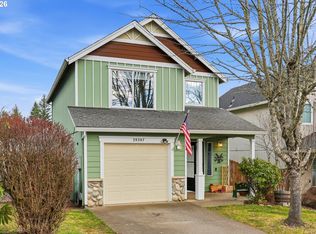
40310 Dubarko Rd, Sandy, OR 97055
3beds
1,658sqft
SingleFamily
Built in 2005
3,484 Square Feet Lot
$445,200 Zestimate®
$269/sqft
$-- HOA
Overview
- 107 days |
- 37 |
- 0 |
Facts & features
Interior
Bedrooms & bathrooms
- Bedrooms: 3
- Bathrooms: 3
- Full bathrooms: 2
- 1/2 bathrooms: 1
Appliances
- Included: Dishwasher, Garbage disposal, Microwave, Range / Oven
Features
- Flooring: Carpet
- Has fireplace: Yes
Interior area
- Total interior livable area: 1,658 sqft
Property
Features
- Exterior features: Other
Lot
- Size: 3,484 Square Feet
Details
- Parcel number: 05012506
Construction
Type & style
- Home type: SingleFamily
Materials
- Roof: Composition
Condition
- Year built: 2005
Community & HOA
Location
- Region: Sandy
Financial & listing details
- Price per square foot: $269/sqft
- Tax assessed value: $450,245
- Annual tax amount: $3,993
Visit our professional directory to find a foreclosure specialist in your area that can help with your home search.
Find a foreclosure agentForeclosure details
Estimated market value
$445,200
$423,000 - $467,000
$2,520/mo
Price history
Price history
| Date | Event | Price |
|---|---|---|
| 10/20/2022 | Sold | $410,000+2.8%$247/sqft |
Source: | ||
| 10/20/2022 | Pending sale | $399,000$241/sqft |
Source: John L Scott Real Estate #22233353 Report a problem | ||
| 10/20/2022 | Listing removed | -- |
Source: John L Scott Real Estate Report a problem | ||
| 8/21/2022 | Pending sale | $399,000$241/sqft |
Source: | ||
| 8/2/2022 | Price change | $399,000-7%$241/sqft |
Source: | ||
| 7/22/2022 | Price change | $429,000-2.3%$259/sqft |
Source: | ||
| 7/15/2022 | Listed for sale | $439,000+75.6%$265/sqft |
Source: | ||
| 3/24/2021 | Listing removed | -- |
Source: Owner Report a problem | ||
| 7/5/2016 | Sold | $250,000+37%$151/sqft |
Source: | ||
| 12/19/2012 | Sold | $182,500-1.4%$110/sqft |
Source: | ||
| 10/13/2012 | Price change | $185,000-2.6%$112/sqft |
Source: Owner Report a problem | ||
| 10/8/2012 | Price change | $190,000-2.6%$115/sqft |
Source: Owner Report a problem | ||
| 8/17/2012 | Price change | $195,000-2%$118/sqft |
Source: Bison Properties #12322801 Report a problem | ||
| 7/10/2012 | Price change | $199,000+7.6%$120/sqft |
Source: Bison Properties #12322801 Report a problem | ||
| 4/30/2012 | Listed for sale | $185,000-19.7%$112/sqft |
Source: Owner Report a problem | ||
| 5/23/2006 | Sold | $230,450$139/sqft |
Source: Public Record Report a problem | ||
Public tax history
Public tax history
| Year | Property taxes | Tax assessment |
|---|---|---|
| 2025 | $3,993 +4.4% | $232,735 +3% |
| 2024 | $3,825 +2.7% | $225,957 +3% |
| 2023 | $3,724 +2.8% | $219,376 +3% |
| 2022 | $3,623 +3.6% | $212,987 +3% |
| 2021 | $3,498 +2.8% | $206,784 +3% |
| 2020 | $3,404 +1% | $200,762 +3% |
| 2019 | $3,371 +2.9% | $194,915 +3% |
| 2018 | $3,277 +5.6% | $189,238 +3% |
| 2017 | $3,102 +0.5% | $183,726 +3% |
| 2016 | $3,087 | $178,375 +3% |
| 2015 | $3,087 +2.9% | $173,180 +3% |
| 2014 | $3,000 +5.6% | $168,136 +3% |
| 2013 | $2,840 +2.2% | $163,239 +3% |
| 2012 | $2,779 +3.5% | $158,484 +3% |
| 2011 | $2,684 +3.1% | $153,868 +3% |
| 2010 | $2,602 +2.8% | $149,386 +3% |
| 2009 | $2,530 +22.5% | $145,035 +3% |
| 2008 | $2,066 +0.7% | $140,811 +3% |
| 2007 | $2,052 +114.5% | $136,710 +110.9% |
| 2006 | $957 | $64,828 |
Find assessor info on the county website
Monthly payment
Estimated monthly payment
All calculations are estimates and provided by Zillow, Inc. for informational purposes only. Actual amounts may vary.
HOA fees may include property taxes on listings classified as Co-Ops. Contact the listing agent and/or owner for fee details.
Mortgage interest rates are dependent on a number of factors, including credit score, down payment, and repayment length. Interest rate data provided by Zillow Group Marketplace, Inc. as of 1/1/1970 from various mortgage lenders with which we have lead or other similar arrangements; the Estimated Payment is an average of those rates.
See how much you could borrow to make a competitive offer.
Climate risks
Neighborhood: 97055
Nearby schools
GreatSchools rating
- 8/10Firwood Elementary SchoolGrades: K-5Distance: 1.7 mi
- 5/10Cedar Ridge Middle SchoolGrades: 6-8Distance: 1.2 mi
- 5/10Sandy High SchoolGrades: 9-12Distance: 1.8 mi
Schools provided by the listing agent
- Elementary: Sandy
- Middle: Cedar Ridge
- High: Sandy
Source: The MLS. This data may not be complete. We recommend contacting the local school district to confirm school assignments for this home.

- Oregon
- Clackamas County
- Sandy
- 97055
- 40310 Dubarko Rd
Nearby cities
Nearby zip codes
Other Sandy Topics
