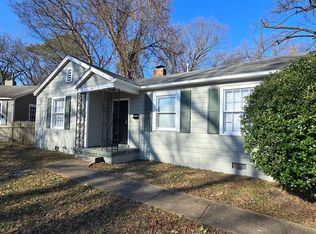
3BR/1BA home. Convenient to all that Midtown offers. Hardwood floors. Central heat/air. Home needs cosmetic work, and seller prefers to sell As Is. New construction home next door is listed for over $500k. Renasant Bank offers some great financial incentives for first time homebuyers on this home, including $7500 in forgivable grant funds that can be used towards a down payment. See attached document for more details.
For sale
$99,900
411 S Fenwick Rd, Memphis, TN 38111
3beds
946sqft
Single Family Residence
Built in 1942
7,840 Square Feet Lot
$-- Zestimate®
$106/sqft
$-- HOA
What's special
Hardwood floors
- 3 days
- 125
- 7
Likely to sell faster than
Zillow last checked:
Listing updated:
Listed by:
Robert M Grisham,
Bluff City Realty Group, LLC 901-303-8448
Source: MAAR,MLS#: 10233360
Facts & features
Interior
Bedrooms & bathrooms
- Bedrooms: 3
- Bathrooms: 1
- Full bathrooms: 1
Primary bedroom
- Dimensions: 0 x 0
Dining room
- Dimensions: 0 x 0
Kitchen
- Features: Washer/Dryer Connections
Living room
- Features: Separate Living Room
- Dimensions: 0 x 0
Den
- Dimensions: 0 x 0
Heating
- Central
Cooling
- Central Air
Features
- All Bedrooms Down, Square Feet Source: AutoFill (MAARdata) or Public Records (Cnty Assessor Site)
- Flooring: Hardwood, Tile
- Doors: Steel Insulated Door(s)
- Windows: Wood Frames
- Has fireplace: No
Interior area
- Total interior livable area: 946 sqft
Property
Parking
- Total spaces: 1
- Parking features: Driveway/Pad
- Covered spaces: 1
- Has uncovered spaces: Yes
Features
- Stories: 1
- Pool features: None
Lot
- Size: 7,840 Square Feet
- Dimensions: 45 x 138
- Features: Some Trees
Details
- Parcel number: 045040 00043
Construction
Type & style
- Home type: SingleFamily
- Architectural style: Traditional
- Property subtype: Single Family Residence
Materials
- Wood/Composition
Condition
- New construction: No
- Year built: 1942
Community & HOA
Community
- Security: Wrought Iron Security Drs
- Subdivision: Burmeister Heights 2nd Addn
Location
- Region: Memphis
Financial & listing details
- Price per square foot: $106/sqft
- Tax assessed value: $125,700
- Annual tax amount: $1,656
- Price range: $99.9K - $99.9K
- Date on market: 10/28/2026
- Cumulative days on market: 16 days
Estimated market value
Not available
Estimated sales range
Not available
$1,006/mo
Price history
| Date | Event | Price |
|---|---|---|
| 10/28/2026 | Listed for sale | $99,900-19.4%$106/sqft |
Source:  MAAR #10233360 Report a problem | ||
| 11/23/2024 | Listing removed | $995$1/sqft |
Source: Zillow Rentals Report a problem | ||
| 11/21/2024 | Listed for rent | $995$1/sqft |
Source: Zillow Rentals Report a problem | ||
| 11/6/2024 | Listing removed | $995$1/sqft |
Source: Zillow Rentals Report a problem | ||
| 10/4/2024 | Listed for rent | $995+43.2%$1/sqft |
Source: Zillow Rentals Report a problem | ||
| 9/19/2024 | Listing removed | $123,900-0.8%$131/sqft |
Source: MAAR #10180158 Report a problem | ||
| 8/29/2024 | Listed for sale | $124,900+177.6%$132/sqft |
Source: MAAR #10180158 Report a problem | ||
| 11/18/2019 | Listing removed | $695$1/sqft |
Source: Belt Line Properties, LLC Report a problem | ||
| 10/26/2019 | Listed for rent | $695-4.1%$1/sqft |
Source: Belt Line Properties, LLC Report a problem | ||
| 12/3/2018 | Listing removed | $725$1/sqft |
Source: Belt Line Properties, LLC Report a problem | ||
| 10/8/2018 | Listed for rent | $725+20.8%$1/sqft |
Source: Belt Line Properties, LLC Report a problem | ||
| 10/30/2015 | Listing removed | $600$1/sqft |
Source: CrestCore Realty LLC Report a problem | ||
| 10/22/2015 | Listed for rent | $600-7.7%$1/sqft |
Source: CrestCore Realty LLC Report a problem | ||
| 2/10/2012 | Listing removed | $650$1/sqft |
Source: vFlyer Rentals Report a problem | ||
| 12/13/2011 | Listed for rent | $650$1/sqft |
Source: vFlyer Rentals Report a problem | ||
| 1/22/2008 | Sold | $45,000$48/sqft |
Source: Public Record Report a problem | ||
| 8/24/2007 | Sold | $45,000-65.4%$48/sqft |
Source: Public Record Report a problem | ||
| 3/19/2007 | Sold | $130,000+116.7%$137/sqft |
Source: Public Record Report a problem | ||
| 1/2/2007 | Sold | $60,000+275%$63/sqft |
Source: Public Record Report a problem | ||
| 7/28/2005 | Sold | $16,000-50.8%$17/sqft |
Source: Public Record Report a problem | ||
| 12/30/2003 | Sold | $32,500-25.3%$34/sqft |
Source: Public Record Report a problem | ||
| 4/18/1996 | Sold | $43,500+137.7%$46/sqft |
Source: Public Record Report a problem | ||
| 5/5/1995 | Sold | $18,300$19/sqft |
Source: Public Record Report a problem | ||
Public tax history
| Year | Property taxes | Tax assessment |
|---|---|---|
| 2025 | $1,656 -1.6% | $31,425 +23% |
| 2024 | $1,683 +8.1% | $25,550 |
| 2023 | $1,556 | $25,550 |
| 2022 | -- | $25,550 -10.7% |
| 2021 | -- | $28,625 +46.8% |
| 2020 | $753 | $19,500 -17.3% |
| 2019 | $753 -21.1% | $23,575 |
| 2018 | $955 -45.1% | $23,575 |
| 2017 | $1,740 +162.5% | $23,575 +20.9% |
| 2016 | $663 -1.1% | $19,500 |
| 2014 | $670 | $19,500 |
| 2013 | -- | $19,500 -7.3% |
| 2012 | -- | $21,025 |
| 2011 | -- | $21,025 |
| 2010 | -- | $21,025 |
| 2009 | -- | $21,025 +44.3% |
| 2008 | -- | $14,575 |
| 2007 | -- | $14,575 |
| 2006 | -- | $14,575 |
| 2005 | -- | $14,575 +43.2% |
| 2004 | -- | $10,175 |
| 2003 | -- | $10,175 |
| 2002 | -- | $10,175 |
| 2001 | -- | $10,175 -12.5% |
| 2000 | -- | $11,625 |
Find assessor info on the county website
Monthly payment
Est. payment