This 2928 square foot single family home has 4 bedrooms and 2.0 bathrooms. This home is located at 4510 SW 133rd Ave, Southwest Ranches, FL 33330.
Pre-foreclosure
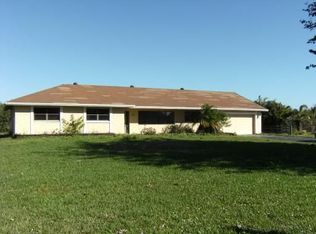
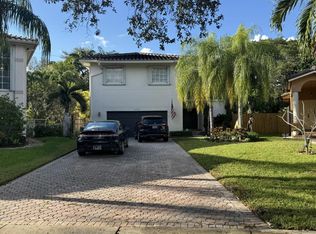
Street View
Est. $955,800
4510 SW 133rd Ave, Southwest Ranches, FL 33330
4beds
2baths
2,928sqft
SingleFamily
Built in 1979
0.82 Acres Lot
$955,800 Zestimate®
$326/sqft
$-- HOA
Overview
- 54 days |
- 70 |
- 5 |
Facts & features
Interior
Bedrooms & bathrooms
- Bedrooms: 4
- Bathrooms: 2
Features
- Flooring: Concrete
Interior area
- Total interior livable area: 2,928 sqft
Property
Features
- Exterior features: Stucco, Cement / Concrete
Lot
- Size: 0.82 Acres
Details
- Parcel number: 504026010190
Construction
Type & style
- Home type: SingleFamily
Materials
- masonry
- Foundation: Other
- Roof: Shake / Shingle
Condition
- Year built: 1979
Community & HOA
Location
- Region: Southwest Ranches
Financial & listing details
- Price per square foot: $326/sqft
- Tax assessed value: $808,630
- Annual tax amount: $6,612
Visit our professional directory to find a foreclosure specialist in your area that can help with your home search.
Find a foreclosure agentForeclosure details
Estimated market value
$955,800
$870,000 - $1.05M
$5,377/mo
Price history
| Date | Event | Price |
|---|---|---|
| 4/10/2001 | Sold | $252,000+44.8%$86/sqft |
Source: Public Record Report a problem | ||
| 12/1/1993 | Sold | $174,000$59/sqft |
Source: Public Record Report a problem | ||
Public tax history
| Year | Property taxes | Tax assessment |
|---|---|---|
| 2024 | $6,612 +1.8% | $324,740 +3% |
| 2023 | $6,497 +5.4% | $315,290 +3% |
| 2022 | $6,163 +6.9% | $306,110 +3% |
| 2021 | $5,765 +2% | $297,200 +1.4% |
| 2020 | $5,655 +1% | $293,100 +2.3% |
| 2019 | $5,597 | $286,520 +1.9% |
| 2018 | $5,597 +1.8% | $281,180 +2.1% |
| 2017 | $5,500 +6.5% | $275,400 +2.1% |
| 2016 | $5,163 +2.8% | $269,740 +0.7% |
| 2015 | $5,023 -1.3% | $267,870 +0.8% |
| 2014 | $5,092 | $265,750 -2.5% |
| 2013 | $5,092 +5.1% | $272,530 -2% |
| 2012 | $4,843 +25.1% | $278,010 -9.9% |
| 2011 | $3,871 -22.9% | $308,520 +27.5% |
| 2010 | $5,021 +3.6% | $242,050 +2.7% |
| 2009 | $4,845 +5.4% | $235,690 +0.1% |
| 2008 | $4,596 -2.2% | $235,460 +3% |
| 2007 | $4,698 +7.1% | $228,610 +2.5% |
| 2006 | $4,386 | $223,040 +3% |
| 2005 | -- | $216,550 +3% |
| 2004 | $4,438 +1.1% | $210,250 +1.9% |
| 2003 | $4,391 +0.6% | $206,330 +2.4% |
| 2002 | $4,367 +24.8% | $201,500 +24.8% |
| 2001 | $3,499 +0.9% | $161,420 |
| 2000 | $3,467 | -- |
Find assessor info on the county website
Monthly payment
Estimated monthly payment$1,822
All calculations are estimates and provided by Zillow, Inc. for informational purposes only. Actual amounts may vary.
HOA fees may include property taxes on listings classified as Co-Ops. Contact the listing agent and/or owner for fee details.
Mortgage interest rates are dependent on a number of factors, including credit score, down payment, and repayment length. Interest rate data provided by Zillow Group Marketplace, Inc. as of 1/1/1970 from various mortgage lenders with which we have lead or other similar arrangements; the Estimated Payment is an average of those rates.
See how much you could borrow to make a competitive offer.
Climate risks
Neighborhood: 33330
Nearby schools
GreatSchools rating
- 9/10Hawkes Bluff Elementary SchoolGrades: PK-5Distance: 2.5 mi
- 7/10Silver Trail Middle SchoolGrades: 6-8Distance: 4.7 mi
- 6/10Cooper City High SchoolGrades: 9-12Distance: 3.4 mi


- Florida
- Broward County
- Southwest Ranches
- 33330
- 4510 SW 133rd Ave
Nearby cities
Nearby zip codes
Other Southwest Ranches Topics
- Apartments for Rent in 33330
- Houses for Sale in 33330
- Houses for Rent in 33330
- 33330 Real Estate
- Southwest Ranches Condos
- Houses for Sale in Southwest Ranches
- Newest Listings in Southwest Ranches
- Southwest Ranches Home Values
- Southwest Ranches Real Estate Agents
- Southwest Ranches Refinance
- Southwest Ranches Mortgage Rates
