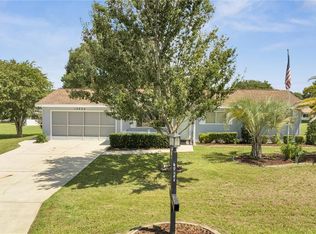
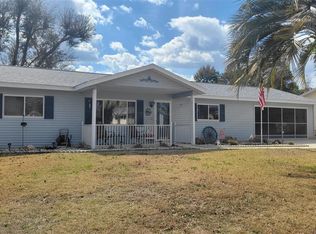
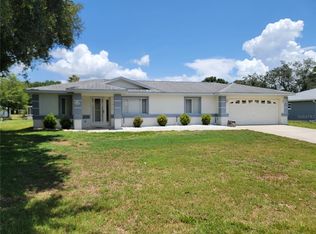
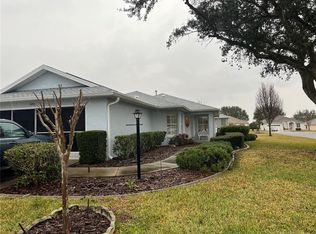
This 2080 square foot single family home has 3 bedrooms and 2.0 bathrooms. This home is located at 10839 SW 78th Ct, Ocala, FL 34476.
Pre-foreclosure
Est. $201,518
10839 SW 78th Ct, Ocala, FL 34476
3beds
2baths
2,080sqft
SingleFamily
Built in 1989
10,018 Square Feet Lot
$-- Zestimate®
$97/sqft
$118/mo HOA
Overview
- 193 days |
- 38 |
- 0 |
Facts & features
Interior
Bedrooms & bathrooms
- Bedrooms: 3
- Bathrooms: 2
Heating
- Forced air, Electric
Cooling
- Central
Appliances
- Included: Dishwasher, Garbage disposal, Range / Oven, Refrigerator
Features
- Flooring: Carpet, Laminate
- Basement: None
- Has fireplace: No
Interior area
- Total interior livable area: 2,080 sqft
Property
Parking
- Total spaces: 2
- Parking features: Garage - Attached
Features
- Exterior features: Shingle, Vinyl
- Has view: Yes
- View description: None
Lot
- Size: 10,018 Square Feet
Details
- Parcel number: 3577400503
Construction
Type & style
- Home type: SingleFamily
Materials
- Foundation: Concrete Block
- Roof: Other
Condition
- Year built: 1989
Community & HOA
Community
- Features: Fifty Five Plus Active Community
- Senior community: Yes
HOA
- Has HOA: Yes
- HOA fee: $118 monthly
Location
- Region: Ocala
Financial & listing details
- Price per square foot: $97/sqft
- Tax assessed value: $201,518
- Annual tax amount: $2,727
Visit our professional directory to find a foreclosure specialist in your area that can help with your home search.
Find a foreclosure agentForeclosure details
Estimated market value
Not available
Estimated sales range
Not available
$1,898/mo
Price history
Price history
| Date | Event | Price |
|---|---|---|
| 2/9/2026 | Listing removed | $229,000$110/sqft |
Source: | ||
| 3/13/2025 | Price change | $229,000-4.2%$110/sqft |
Source: | ||
| 2/11/2025 | Listed for sale | $239,000-4%$115/sqft |
Source: | ||
| 11/5/2024 | Listing removed | $249,000-2.4%$120/sqft |
Source: | ||
| 10/15/2024 | Price change | $255,000-1.5%$123/sqft |
Source: | ||
| 8/14/2024 | Price change | $259,000-3%$125/sqft |
Source: | ||
| 7/24/2024 | Price change | $267,000-1.1%$128/sqft |
Source: | ||
| 7/10/2024 | Listed for sale | $270,000-1.8%$130/sqft |
Source: | ||
| 7/2/2024 | Listing removed | -- |
Source: Owner Report a problem | ||
| 6/30/2024 | Listed for sale | $275,000+35.5%$132/sqft |
Source: Owner Report a problem | ||
| 6/30/2022 | Sold | $203,000+2%$98/sqft |
Source: Public Record Report a problem | ||
| 5/11/2022 | Pending sale | $199,000$96/sqft |
Source: | ||
| 5/9/2022 | Listed for sale | $199,000+184.3%$96/sqft |
Source: | ||
| 9/21/2012 | Sold | $70,000-54.2%$34/sqft |
Source: Public Record Report a problem | ||
| 3/27/2006 | Sold | $152,900+24.3%$74/sqft |
Source: Public Record Report a problem | ||
| 12/16/2005 | Sold | $123,000$59/sqft |
Source: Public Record Report a problem | ||
Public tax history
Public tax history
| Year | Property taxes | Tax assessment |
|---|---|---|
| 2024 | $2,727 +2.6% | $195,023 +3% |
| 2023 | $2,659 +234.8% | $189,343 +184% |
| 2022 | $794 -0.9% | $66,678 +3% |
| 2021 | $801 +0.2% | $64,736 +1.4% |
| 2020 | $800 +0.5% | $63,842 +2.3% |
| 2019 | $796 | $62,407 +1.9% |
| 2018 | $796 +4.4% | $61,243 +2.1% |
| 2017 | $763 +3.1% | $59,983 +2.1% |
| 2016 | $740 | $58,749 +0.7% |
| 2015 | $740 +4.5% | $58,341 +0.8% |
| 2014 | $708 +1% | $57,878 +0.6% |
| 2013 | $701 -2.5% | $57,517 -2.1% |
| 2012 | $719 -6.8% | $58,776 -10.1% |
| 2011 | $771 -5.5% | $65,382 -8.7% |
| 2010 | $816 -13.5% | $71,634 -13.2% |
| 2009 | $943 -30.2% | $82,518 -25.4% |
| 2008 | $1,352 -11.5% | $110,640 +0.4% |
| 2007 | $1,528 -13.7% | $110,150 +20.5% |
| 2006 | $1,770 +143.5% | $91,438 +64.4% |
| 2005 | $727 | $55,633 +3% |
| 2004 | $727 +10.8% | $54,013 +4.3% |
| 2002 | $656 +12.4% | $51,764 +4.6% |
| 2001 | $584 | $49,466 |
| 2000 | $584 | $49,466 |
Find assessor info on the county website
BuyAbility℠ payment
Estimated monthly payment
Boost your down payment with 6% savings match
Earn up to a 6% match & get a competitive APY with a *. Zillow has partnered with to help get you home faster.
Learn more*Terms apply. Match provided by Foyer. Account offered by Pacific West Bank, Member FDIC.Climate risks
Neighborhood: 34476
Nearby schools
GreatSchools rating
- 4/10Marion Oaks Elementary SchoolGrades: PK-5Distance: 4 mi
- 3/10Horizon Academy At Marion OaksGrades: 5-8Distance: 5.5 mi
- 4/10West Port High SchoolGrades: 9-12Distance: 6.1 mi