$335,000
2 bd|2 ba|1.1k sqft
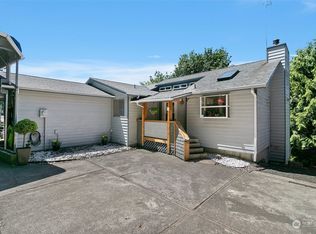
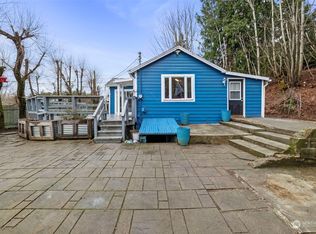
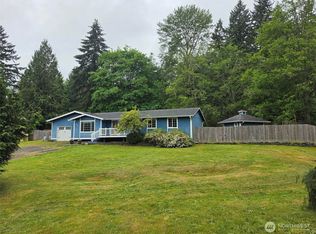
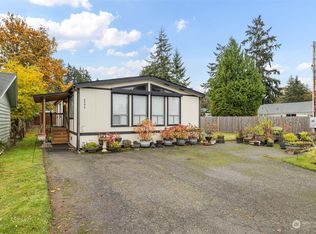
4594 SE Horstman Rd, Pt Orchard, WA 98366
Sold
Zillow last checked:
Listing updated:
Erica Tudela,
Paramount Real Estate Group,
Derrick Tudela,
Paramount Real Estate Group
Visit our professional directory to find a foreclosure specialist in your area that can help with your home search.
Find a foreclosure agent$457,100
$425,000 - $485,000
$2,576/mo
| Date | Event | Price |
|---|---|---|
| 10/9/2025 | Sold | $418,650+10.2%$239/sqft |
Source: Public Record Report a problem | ||
| 5/10/2024 | Sold | $380,000+123.5%$217/sqft |
Source: | ||
| 4/29/2016 | Sold | $170,000+0.1%$97/sqft |
Source: | ||
| 9/2/2015 | Pending sale | $169,900+33.3%$97/sqft |
Source: Windermere Real Estate/Bellevue Commons, Inc. #834626 Report a problem | ||
| 3/25/2015 | Sold | $127,500+16%$73/sqft |
Source: Public Record Report a problem | ||
| 3/12/2015 | Price change | $109,899-8.3%$63/sqft |
Source: John L Scott Real Estate #726754 Report a problem | ||
| 3/5/2015 | Price change | $119,899-4%$69/sqft |
Source: John L Scott Real Estate #726754 Report a problem | ||
| 2/18/2015 | Price change | $124,899-5.3%$71/sqft |
Source: John L Scott Real Estate #726754 Report a problem | ||
| 2/6/2015 | Price change | $131,899-7%$75/sqft |
Source: John L Scott Real Estate #726754 Report a problem | ||
| 1/27/2015 | Price change | $141,899-4.1%$81/sqft |
Source: John L Scott Real Estate #726754 Report a problem | ||
| 1/17/2015 | Price change | $147,899-3.3%$85/sqft |
Source: John L Scott Real Estate #726754 Report a problem | ||
| 1/2/2015 | Listed for sale | $152,899-12.6%$87/sqft |
Source: John L Scott Real Estate #726754 Report a problem | ||
| 9/24/2013 | Listing removed | $174,999$100/sqft |
Source: John L Scott Real Estate #522292 Report a problem | ||
| 8/6/2013 | Price change | $174,999-2.8%$100/sqft |
Source: John L Scott Real Estate #522292 Report a problem | ||
| 7/26/2013 | Listed for sale | $179,999+5.9%$103/sqft |
Source: John L Scott Real Estate #522292 Report a problem | ||
| 9/11/2012 | Listing removed | $169,999$97/sqft |
Source: John L Scott Real Estate #338485 Report a problem | ||
| 4/3/2012 | Listed for sale | $169,999-5.4%$97/sqft |
Source: John L Scott Real Estate #338485 Report a problem | ||
| 9/9/2011 | Listing removed | $179,777$103/sqft |
Source: Windermere #160453 Report a problem | ||
| 7/8/2011 | Listed for sale | $179,777$103/sqft |
Source: Windermere Real Estate/Port Orchard #160453 Report a problem | ||
| 7/5/2011 | Pending sale | $179,777$103/sqft |
Source: Windermere Real Estate/Port Orchard #160453 Report a problem | ||
| 2/28/2011 | Price change | $179,777-5.4%$103/sqft |
Source: Windermere Real Estate/Port Orchard #160453 Report a problem | ||
| 12/11/2010 | Listed for sale | $189,999-3.9%$109/sqft |
Source: Windermere Real Estate/Port Orchard #160453 Report a problem | ||
| 7/10/2010 | Listing removed | $197,777$113/sqft |
Source: Windermere Report a problem | ||
| 4/3/2010 | Price change | $197,777-4.8%$113/sqft |
Source: Windermere Real Estate/Port Orchard #27198547 Report a problem | ||
| 3/12/2010 | Listed for sale | $207,777-1%$119/sqft |
Source: Windermere Real Estate/Port Orchard #27198547 Report a problem | ||
| 5/4/2008 | Listing removed | $209,777$120/sqft |
Source: NCI Report a problem | ||
| 4/6/2008 | Listed for sale | $209,777+13.4%$120/sqft |
Source: NCI Report a problem | ||
| 1/12/2006 | Sold | $185,000+96.8%$106/sqft |
Source: | ||
| 3/30/1998 | Sold | $94,000$54/sqft |
Source: Public Record Report a problem | ||
| Year | Property taxes | Tax assessment |
|---|---|---|
| 2024 | $2,953 +3.2% | $347,950 |
| 2023 | $2,863 +0.6% | $347,950 |
| 2022 | $2,845 +4.3% | $347,950 +24.6% |
| 2021 | $2,727 +4.2% | $279,290 +10.3% |
| 2020 | $2,618 +24.5% | $253,300 +16.5% |
| 2019 | $2,103 -8.9% | $217,400 +32.6% |
| 2018 | $2,310 | $163,920 |
| 2017 | $2,310 +25.3% | $163,920 +10.4% |
| 2016 | $1,843 +1.1% | $148,420 +1.9% |
| 2015 | $1,822 | $145,690 +1.3% |
| 2014 | $1,822 +3.3% | $143,860 -8.6% |
| 2013 | $1,765 -6% | $157,360 -2.3% |
| 2012 | $1,878 +3.3% | $161,080 -3.4% |
| 2011 | $1,817 +11.3% | $166,680 +4.4% |
| 2010 | $1,633 +3.8% | $159,700 -9.4% |
| 2009 | $1,573 -0.6% | $176,340 -4.1% |
| 2008 | $1,582 -2.9% | $183,830 +8.2% |
| 2007 | $1,630 +17.9% | $169,830 +45.7% |
| 2005 | $1,383 | $116,540 +19% |
| 2002 | -- | $97,920 |
Find assessor info on the county website