This 3115 square foot single family home has 4 bedrooms and 4.0 bathrooms. This home is located at 465 Ridgeway Rd, Henderson, NV 89015.
Pre-foreclosure
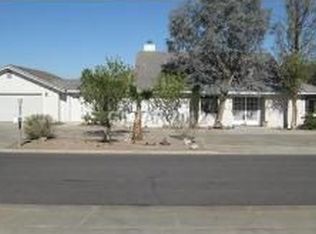
Street View
Est. $1,117,600
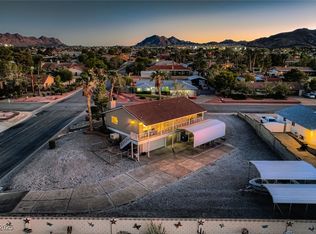
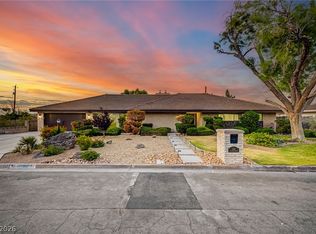
465 Ridgeway Rd, Henderson, NV 89015
4beds
4baths
3,115sqft
SingleFamily
Built in 1977
1.16 Acres Lot
$1,117,600 Zestimate®
$359/sqft
$-- HOA
Overview
- 294 days |
- 39 |
- 3 |
Facts & features
Interior
Bedrooms & bathrooms
- Bedrooms: 4
- Bathrooms: 4
Heating
- Forced air
Cooling
- Central
Features
- Basement: Finished
- Has fireplace: Yes
Interior area
- Total interior livable area: 3,115 sqft
Property
Parking
- Parking features: Garage - Attached
Features
- Exterior features: Stucco
Lot
- Size: 1.16 Acres
Details
- Parcel number: 17919206011
Construction
Type & style
- Home type: SingleFamily
Materials
- Frame
Condition
- Year built: 1977
Community & HOA
Location
- Region: Henderson
Financial & listing details
- Price per square foot: $359/sqft
- Tax assessed value: $792,897
- Annual tax amount: $4,391
Visit our professional directory to find a foreclosure specialist in your area that can help with your home search.
Find a foreclosure agentForeclosure details
Estimated market value
$1,117,600
$995,000 - $1.26M
$4,084/mo
Price history
| Date | Event | Price |
|---|---|---|
| 10/27/2022 | Sold | $710,000+57.8%$228/sqft |
Source: Public Record Report a problem | ||
| 5/12/2003 | Sold | $450,000+16.9%$144/sqft |
Source: Public Record Report a problem | ||
| 3/1/2001 | Sold | $385,000+61.8%$124/sqft |
Source: Public Record Report a problem | ||
| 3/31/1995 | Sold | $238,000$76/sqft |
Source: Public Record Report a problem | ||
Public tax history
| Year | Property taxes | Tax assessment |
|---|---|---|
| 2026 | $4,391 +12.5% | $277,514 -0.3% |
| 2025 | $3,903 +8% | $278,434 +13.4% |
| 2024 | $3,615 +8% | $245,455 +5.7% |
| 2023 | $3,347 +8% | $232,122 +11.5% |
| 2022 | $3,099 +7.7% | $208,238 +8.9% |
| 2021 | $2,877 +6.7% | $191,147 +4.6% |
| 2020 | $2,696 +4.8% | $182,669 +11.5% |
| 2019 | $2,573 +6.9% | $163,884 |
| 2018 | $2,407 | $163,884 -1.8% |
| 2017 | $2,407 | $166,875 +2.5% |
| 2016 | $2,407 +3.4% | $162,780 +102.8% |
| 2015 | $2,327 | $80,259 +1.8% |
| 2014 | $2,327 | $78,868 |
| 2013 | -- | $78,868 -15.7% |
| 2012 | -- | $93,539 +0.8% |
| 2011 | -- | $92,768 -2.2% |
| 2010 | -- | $94,871 -47.8% |
| 2009 | -- | $181,873 |
| 2008 | -- | $181,873 -16.7% |
| 2007 | -- | $218,373 +2.8% |
| 2006 | -- | $212,516 +52.8% |
| 2005 | -- | $139,087 +31.5% |
| 2004 | -- | $105,809 +8.8% |
| 2003 | -- | $97,241 -0.4% |
| 2002 | -- | $97,660 +1.9% |
| 2001 | -- | $95,880 |
Find assessor info on the county website
Monthly payment
Climate risks
Neighborhood: Black Mountain
Nearby schools
GreatSchools rating
- 7/10Ulis Newton Elementary SchoolGrades: PK-5Distance: 0.9 mi
- 7/10Jack & Terry Mannion Middle SchoolGrades: 6-8Distance: 2.3 mi
- 5/10Foothill High SchoolGrades: 9-12Distance: 1.9 mi
- $708,0005 bd3 ba3.2k sqft141 W Mulberry Dr, Henderson, NV 89015Off Market
- $564,7003 bd2 ba2.1k sqft140 W Cypress Dr, Henderson, NV 89015Off Market
- $535,0002 bd2 ba1.8k sqft200 W Cypress Dr, Henderson, NV 89015Sold
- $678,0003 bd3 ba2k sqft201 W Mulberry Dr, Henderson, NV 89015Off Market
- $930,1006 bd3 ba4.6k sqft180 W Mulberry Dr, Henderson, NV 89015Off Market
- $695,7004 bd4 ba2.9k sqft181 W Cypress Dr, Henderson, NV 89015Off Market
- $499,9003 bd2 ba1.6k sqft161 W Cypress Dr, Henderson, NV 89015Off Market
- $654,2003 bd2 ba2.5k sqft160 W Mulberry Dr, Henderson, NV 89015Off Market
Similar homes
- $1,099,0005 bd4 ba3.9k sqft153 Montevallo Bend St, Henderson, NV 89015For Sale
 MLS ID #2802218, Nicole Pucci, Simply Vegas. LVR
 - $975,0004 bd4 ba2.8k sqft236 E Country Club Dr, Henderson, NV 89015For Sale
 MLS ID #2785455, Donna Oliva, Simply Vegas. LVR
 - $999,9904 bd3 ba3.5k sqft330 E Country Club Dr, Henderson, NV 89015For Sale
 MLS ID #2773078, Brian J. Mangino, Huntington & Ellis, A Real Est. LVR
 - $975,0006 bd5 ba3k sqft271 E Middleton Dr, Henderson, NV 89015For Sale
 MLS ID #2786604, Ron Nir, Desert Horizon Realty. LVR
 - $849,9003 bd3 ba3k sqft120 W Middleton Dr, Henderson, NV 89015For SaleMLS ID #2782143, Julie Anderson, Buyers Realty USA. LVR
- $715,0004 bd2 ba2.3k sqft121 E Mulberry Dr, Henderson, NV 89015For SaleMLS ID #2790373, Dana Limon, Signature Real Estate Group. LVR
- $689,9004 bd3 ba2.4k sqft429 Crestway Rd, Henderson, NV 89015For SaleMLS ID #2788936, Justin Perry, LIFE Realty District. LVR
- $1,149,9904 bd4 ba3.6k sqft334 Natoire Ct, Henderson, NV 89012For SaleMLS ID #2788624, Sajan I. Abraham, Realty 360. LVR
- $746,5004 bd3 ba3.4k sqft281 E Kimberly Dr, Henderson, NV 89015For SaleMLS ID #2743258, Karen L. Spaulding, BHHS Nevada Properties. LVR
- $964,2005 bd4 ba3.9k sqft234 Bellevue Grove Ave, Henderson, NV 89015For SaleMLS ID #2767124, Justin Adams, Evolve Realty. LVR
- $1,199,9995 bd4 ba3.9k sqft199 Bellevue Grove Ave, Henderson, NV 89015For SaleMLS ID #2749534, Jason W. Marker, Local Living Real Estate. LVR
- $959,0004 bd6 ba3.4k sqft261 Crimson Edge St, Henderson, NV 89012For SaleMLS ID #2790903, Nicole Merriman, eXp Realty. LVR
- $749,9005 bd5 ba3.4k sqft206 Valerian St, Henderson, NV 89015For SaleMLS ID #2799313, Angel Bothof, Angel Bothof. LVR
- $610,0004 bd3 ba2.3k sqft584 Mona Ln, Henderson, NV 89015For SaleMLS ID #2758483, Richard Husel, Keller Williams MarketPlace. LVR
- $825,0004 bd4 ba2.6k sqft116 Barclay Heights Ave, Henderson, NV 89015For SaleMLS ID #2753848, Beau A. McDougall, NextHome People First. LVR
- $889,5005 bd4 ba3.9k sqft206 Devon Crest Ct, Henderson, NV 89015New ConstructionLVR
- $649,0004 bd4 ba3.4k sqft874 Ashford Way, Henderson, NV 89015For SaleMLS ID #2774002, Irma Duafala, Royal Diamond Realty. LVR
- $679,0006 bd5 ba3.6k sqft354 Shimmering Moon St, Henderson, NV 89015For SaleMLS ID #2802631, Danielle Roth, Rossum Realty Unlimited. LVR
- $559,0003 bd3 ba2.3k sqft849 Ashford Way, Henderson, NV 89015For SaleMLS ID #2791597, Heide Hanley, Realty ONE Group, Inc. LVR
- $599,9903 bd3 ba3.1k sqft865 Bussora Rose Dr, Henderson, NV 89015For SaleMLS ID #2782826, Damon Caldwell, Realty ONE Group, Inc. LVR
