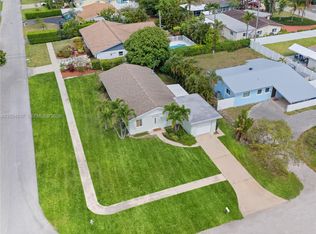
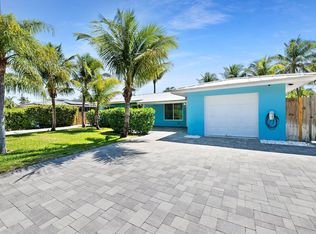
This 1766 square foot single family home has 3 bedrooms and 2.0 bathrooms. This home is located at 469 NE 35th St, Boca Raton, FL 33431.
Pre-foreclosure
Est. $667,400
469 NE 35th St, Boca Raton, FL 33431
3beds
2baths
1,766sqft
SingleFamily
Built in 1959
2,195 Square Feet Lot
$667,400 Zestimate®
$378/sqft
$-- HOA
Overview
- 325 days |
- 123 |
- 5 |
Facts & features
Interior
Bedrooms & bathrooms
- Bedrooms: 3
- Bathrooms: 2
Heating
- Forced air
Cooling
- Other
Appliances
- Included: Dishwasher, Dryer, Washer
- Laundry: In Unit
Features
- Flooring: Carpet
- Furnished: Yes
Interior area
- Total interior livable area: 1,766 sqft
Property
Parking
- Parking features: Off-street, Garage
Features
- Exterior features: Stucco
Lot
- Size: 2,195 Square Feet
Details
- Parcel number: 06434708040540231
Construction
Type & style
- Home type: SingleFamily
Materials
- masonry
- Roof: Tile
Condition
- Year built: 1959
Community & HOA
Location
- Region: Boca Raton
Financial & listing details
- Price per square foot: $378/sqft
- Tax assessed value: $502,707
- Annual tax amount: $8,901
Visit our professional directory to find a foreclosure specialist in your area that can help with your home search.
Find a foreclosure agentForeclosure details
Estimated market value
$667,400
$594,000 - $747,000
$4,175/mo
Price history
| Date | Event | Price |
|---|---|---|
| 7/27/2024 | Listing removed | -- |
Source: Zillow Rentals Report a problem | ||
| 3/15/2024 | Listed for rent | $5,500+10%$3/sqft |
Source: Zillow Rentals Report a problem | ||
| 10/29/2023 | Listing removed | -- |
Source: Zillow Rentals Report a problem | ||
| 10/1/2023 | Listed for rent | $5,000$3/sqft |
Source: Zillow Rentals Report a problem | ||
| 9/1/2023 | Listing removed | -- |
Source: Zillow Rentals Report a problem | ||
| 3/22/2023 | Listed for rent | $5,000$3/sqft |
Source: Zillow Rentals Report a problem | ||
| 3/10/2023 | Listing removed | -- |
Source: Zillow Rentals Report a problem | ||
| 1/26/2023 | Listed for rent | $5,000-13%$3/sqft |
Source: Zillow Rentals Report a problem | ||
| 10/26/2022 | Listing removed | -- |
Source: Zillow Rental Manager Report a problem | ||
| 9/9/2022 | Price change | $5,750+21.1%$3/sqft |
Source: Zillow Rental Manager Report a problem | ||
| 8/6/2022 | Price change | $4,750-14.4%$3/sqft |
Source: Zillow Rental Manager Report a problem | ||
| 7/24/2022 | Price change | $5,550-6.7%$3/sqft |
Source: Zillow Rental Manager Report a problem | ||
| 7/14/2022 | Price change | $5,950-8.5%$3/sqft |
Source: Zillow Rental Manager Report a problem | ||
| 6/13/2022 | Listed for rent | $6,500$4/sqft |
Source: Zillow Rental Manager Report a problem | ||
| 5/24/2022 | Sold | $431,000+13.5%$244/sqft |
Source: Public Record Report a problem | ||
| 8/2/2018 | Listing removed | $379,900$215/sqft |
Source: United Realty Group Inc #F10122086 Report a problem | ||
| 6/1/2018 | Price change | $379,900-5%$215/sqft |
Source: United Realty Group Inc #F10122086 Report a problem | ||
| 5/10/2018 | Listed for sale | $399,900$226/sqft |
Source: United Realty Group Inc #F10122086 Report a problem | ||
Public tax history
| Year | Property taxes | Tax assessment |
|---|---|---|
| 2024 | $8,901 -5.7% | $502,707 -5.1% |
| 2023 | $9,436 +15% | $529,953 +18.3% |
| 2022 | $8,204 +275.5% | $447,894 +198% |
| 2021 | $2,185 +1.8% | $150,297 +1.4% |
| 2020 | $2,147 +1.5% | $148,222 +2.3% |
| 2019 | $2,114 | $144,890 +1.9% |
| 2018 | $2,114 +6.3% | $142,188 +2.1% |
| 2017 | $1,989 +1.7% | $139,263 +2.1% |
| 2016 | $1,955 +1.3% | $136,399 +0.7% |
| 2015 | $1,929 -1.8% | $135,451 +0.8% |
| 2014 | $1,964 +1.8% | $134,376 +1.5% |
| 2013 | $1,930 -5.5% | $132,390 +1.7% |
| 2012 | $2,041 +2.6% | $130,177 +3% |
| 2011 | $1,989 +10.3% | $126,385 +1.5% |
| 2010 | $1,803 +8.9% | $124,517 +2.7% |
| 2009 | $1,655 +2.2% | $121,243 +0.1% |
| 2008 | $1,619 -8.9% | $121,122 +3% |
| 2007 | $1,778 -5% | $117,594 +2.5% |
| 2006 | $1,872 | $114,726 +3% |
| 2005 | -- | $111,384 +3% |
| 2004 | $925 +789% | $108,140 +1.9% |
| 2003 | $104 -94% | $106,124 +2.4% |
| 2002 | $1,728 +0.3% | $103,637 +1.6% |
| 2001 | $1,723 +4.1% | $102,005 +3% |
| 2000 | $1,655 +14.7% | $99,034 -2.1% |
| 1999 | $1,443 | $101,134 |
Find assessor info on the county website
Monthly payment
Estimated monthly payment$1,822
All calculations are estimates and provided by Zillow, Inc. for informational purposes only. Actual amounts may vary.
HOA fees may include property taxes on listings classified as Co-Ops. Contact the listing agent and/or owner for fee details.
Mortgage interest rates are dependent on a number of factors, including credit score, down payment, and repayment length. Interest rate data provided by Zillow Group Marketplace, Inc. as of 1/1/1970 from various mortgage lenders with which we have lead or other similar arrangements; the Estimated Payment is an average of those rates.
See how much you could borrow to make a competitive offer.
Climate risks
Neighborhood: 33431
Nearby schools
GreatSchools rating
- 4/10J. C. Mitchell Elementary SchoolGrades: PK-5Distance: 1 mi
- 8/10Boca Raton Community Middle SchoolGrades: 6-8Distance: 2.6 mi
- 6/10Boca Raton Community High SchoolGrades: 9-12Distance: 2.6 mi


- Florida
- Palm Beach County
- Boca Raton
- 33431
- 469 NE 35th St
Nearby cities
Nearby neighborhoods
Nearby zip codes
Other Boca Raton Topics
