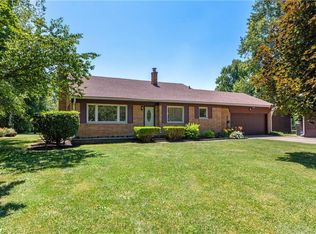
Welcome to this stunning, fully renovated luxury ranch situated on a private 1.29-acre lot, offering the perfect blend of modern elegance, premium craftsmanship, and everyday convenience. Every inch of this move-in-ready home has been thoughtfully redesigned with high-end finishes, creating a sophisticated living experience both inside and out. Step into a bright, open-concept floor plan featuring luxury vinyl plank flooring, designer LED lighting, and contemporary finishes throughout. The beautifully remodeled gourmet kitchen showcases granite countertops, a custom tile backsplash, brand-new stainless-steel appliances, abundant cabinetry, and an inviting layout that's perfect for entertaining and everyday living. The spacious family room is designed to impress, featuring a custom fireplace with a striking acoustic feature wall that creates a warm and elegant focal point. The luxurious primary and guest bathrooms have been completely remodeled with spa-inspired finishes, including floor-to-ceiling designer tile, premium vanities, upscale fixtures, and modern lighting. Additional upgrades include a new air conditioning system, fresh Sherwin-Williams interior and exterior paint, a freshly painted oversized garage, and a versatile loft ideal for a home office, media room, fitness space, or playroom. Outside, enjoy the privacy and possibilities of the expansive 1.29-acre lot. The oversized driveway provides ample parking for multiple vehicles, guests, recreational vehicles, trailers, or even a home-based business. Conveniently located just minutes from I-465, this exceptional property offers quick access to downtown Indianapolis, major employers, shopping, restaurants, parks, and everyday conveniences including Lowe's, Walmart, grocery stores, and more. Combining modern luxury, premium upgrades, generous living space, and an unbeatable location, this beautifully renovated home is truly move-in ready. Don't miss your opportunity to own this exceptional
Pending
$298,900
4813 E Thompson Rd, Indianapolis, IN 46237
4beds
2,238sqft
Residential, Single Family Residence
Built in 1968
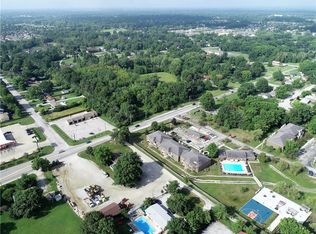
1.29 Acres Lot
$-- Zestimate®
$134/sqft
$-- HOA
What's special
Modern lightingUpscale fixturesSpacious family roomContemporary finishes throughoutSpa-inspired finishesPremium vanitiesGranite countertops
- 22 days |
- 610 |
- 134 |
Likely to sell faster than
Zillow last checked:
Listing updated:
Listed by:
Ashok Challa 551-580-3386,
@Home Indiana
Source: MIBOR as distributed by MLS GRID,MLS#: 22110767
Facts & features
Interior
Bedrooms & bathrooms
- Bedrooms: 4
- Bathrooms: 2
- Full bathrooms: 2
- Main level bathrooms: 2
- Main level bedrooms: 4
Primary bedroom
- Level: Main
- Area: 120 Square Feet
- Dimensions: 12x10
Bedroom 2
- Level: Main
- Area: 110 Square Feet
- Dimensions: 11x10
Bedroom 3
- Level: Main
- Area: 110 Square Feet
- Dimensions: 11x10
Bedroom 4
- Level: Main
- Area: 100 Square Feet
- Dimensions: 10x10
Breakfast room
- Level: Main
- Area: 60 Square Feet
- Dimensions: 10x06
Dining room
- Level: Main
- Area: 100 Square Feet
- Dimensions: 10x10
Kitchen
- Level: Main
- Area: 100 Square Feet
- Dimensions: 10x10
Laundry
- Level: Main
- Area: 60 Square Feet
- Dimensions: 10x06
Living room
- Level: Main
- Area: 100 Square Feet
- Dimensions: 10x10
Sun room
- Level: Main
- Area: 144 Square Feet
- Dimensions: 12x12
Heating
- Forced Air, Natural Gas
Cooling
- Central Air
Appliances
- Included: Dishwasher, Disposal, Gas Water Heater, Microwave, Electric Oven
- Laundry: Laundry Room
Features
- Attic Access, Breakfast Bar
- Has basement: No
- Attic: Access Only
- Number of fireplaces: 1
- Fireplace features: Electric
Interior area
- Total structure area: 2,238
- Total interior livable area: 2,238 sqft
Property
Parking
- Total spaces: 2
- Parking features: Attached
- Attached garage spaces: 2
Features
- Levels: One
- Stories: 1
- Has view: Yes
- View description: Trees/Woods
Lot
- Size: 1.29 Acres
Details
- Parcel number: 491504102026000500
- Horse amenities: None
Construction
Type & style
- Home type: SingleFamily
- Architectural style: Ranch
- Property subtype: Residential, Single Family Residence
Materials
- Brick
- Foundation: Block
Condition
- New construction: No
- Year built: 1968
Utilities & green energy
- Water: Private
Community & HOA
Community
- Security: Smoke Detector(s)
- Subdivision: No Subdivision
HOA
- Has HOA: No
Location
- Region: Indianapolis
Financial & listing details
- Price per square foot: $134/sqft
- Tax assessed value: $288,900
- Annual tax amount: $3,296
- Date on market: 6/28/2026
- Cumulative days on market: 22 days
Estimated market value
Not available
Estimated sales range
Not available
Not available
Price history
| Date | Event | Price |
|---|---|---|
| 6/29/2026 | Pending sale | $298,900$134/sqft |
Source: | ||
| 6/28/2026 | Listed for sale | $298,900+53.7%$134/sqft |
Source: | ||
| 3/9/2026 | Sold | $194,500-2.7%$87/sqft |
Source: | ||
| 2/17/2026 | Pending sale | $199,900$89/sqft |
Source: | ||
| 2/16/2026 | Price change | $199,900-13.1%$89/sqft |
Source: | ||
| 2/13/2026 | Pending sale | $230,000$103/sqft |
Source: Owner Report a problem | ||
| 1/30/2026 | Listed for sale | $230,000-17.9%$103/sqft |
Source: Owner Report a problem | ||
| 6/25/2024 | Listing removed | -- |
Source: Owner Report a problem | ||
| 6/15/2024 | Listed for sale | $280,000+3.7%$125/sqft |
Source: Owner Report a problem | ||
| 11/7/2023 | Listing removed | -- |
Source: Owner Report a problem | ||
| 10/28/2023 | Price change | $270,000+58.8%$121/sqft |
Source: Owner Report a problem | ||
| 10/27/2023 | Listed for sale | $170,000-40.4%$76/sqft |
Source: Owner Report a problem | ||
| 10/15/2023 | Listing removed | -- |
Source: Owner Report a problem | ||
| 10/12/2023 | Listed for sale | $285,000$127/sqft |
Source: Owner Report a problem | ||
Public tax history
| Year | Property taxes | Tax assessment |
|---|---|---|
| 2025 | $3,296 +7.6% | $288,900 +12.7% |
| 2024 | $3,063 +5.8% | $256,300 +6.5% |
| 2023 | $2,895 +19.6% | $240,600 +8.2% |
| 2022 | $2,422 -45.3% | $222,400 +20.3% |
| 2021 | $4,427 +37.4% | $184,800 +9.2% |
| 2020 | $3,223 +1.3% | $169,200 +38.3% |
| 2019 | $3,183 +81.8% | $122,300 +0.2% |
| 2018 | $1,750 -3.2% | $122,000 +0.8% |
| 2017 | $1,808 +75.8% | $121,000 +3% |
| 2016 | $1,028 +48.2% | $117,500 -1.1% |
| 2014 | $694 -30.5% | $118,800 |
| 2013 | $998 | $118,800 +2.9% |
| 2012 | $998 | $115,400 +1% |
| 2011 | -- | $114,300 |
| 2010 | $840 +26.2% | $114,300 |
| 2009 | $666 | $114,300 -6.6% |
| 2007 | -- | $122,400 -0.1% |
| 2006 | -- | $122,500 |
| 2005 | -- | $122,500 |
| 2004 | -- | $122,500 -12.1% |
| 2003 | -- | $139,300 +97.3% |
| 2002 | -- | $70,600 +200% |
| 2001 | -- | $23,530 |
| 2000 | -- | $23,530 |
Find assessor info on the county website
Monthly payment
Est. payment
Payment breakdown
Explore the cost of this home by adjusting the details. Changes won't be saved.Climate risks
Neighborhood: South Emerson
Nearby schools
GreatSchools rating
- 7/10Jeremiah Gray-Edison Elementary SchoolGrades: 1-5Distance: 0.4 mi
- 6/10Southport Middle SchoolGrades: 7-8Distance: 1.8 mi
- 4/10Southport High SchoolGrades: 9-12Distance: 3.3 mi
Schools provided by the listing agent
- Elementary: Jeremiah Gray Elementary School
- Middle: Southport Middle School
- High: Southport High School
Source: MIBOR as distributed by MLS GRID. This data may not be complete. We recommend contacting the local school district to confirm school assignments for this home.
- $319,7003 bd1 ba1.6k sqft4719 E Thompson Rd, Indianapolis, IN 46237Off Market
- $1,900-- bd-- ba-- sqft4719 E Thompson Rd, Indianapolis, IN 46237Off Market
- $301,7004.47 Acres4815 E Thompson Rd, Indianapolis, IN 46237Off Market
- $324,7003 bd2 ba1.8k sqft4715 E Thompson Rd, Indianapolis, IN 46237Off Market
- $230,4004 bd2 ba1.6k sqft1721 Yazoo Dr, Beech Grove, IN 46107Off Market
- $243,8003 bd2 ba1.6k sqft13 Oakmont Ct, Beech Grove, IN 46107Off Market
- $194,0003 bd-- ba1k sqft5 Oakmont Ct, Beech Grove, IN 46107Off Market
- $185,0004 bd2 ba1.6k sqft9 Oakmont Ct, Beech Grove, IN 46107Sold
A local agent can set up tours, give advice and negotiate with sellers.
Similar homes
- $240,0003 bd2 ba1.3k sqft5706 Riva Ridge Dr, Indianapolis, IN 46237Active
 MLS ID #22109903, Becky Gluff, Keller Williams Indy Metro Partners. MIBOR as distributed by MLS GRID
 - $350,0004 bd2 ba2.6k sqft3806 S Emerson Ave, Indianapolis, IN 46203Active
 MLS ID #22110457, Emily Brewer, Redfin Corporation. MIBOR as distributed by MLS GRID
 - $335,0004 bd3 ba1.8k sqft4230 Five Points Rd, Indianapolis, IN 46239Active
 MLS ID #22109229, Sam Southworth, Indianapolis Homes Realty Group. MIBOR as distributed by MLS GRID
 - $309,0003 bd2 ba3k sqft236 Bixler Rd, Indianapolis, IN 46227Active
 MLS ID #22107816, Eric Avila, Trueblood Real Estate. MIBOR as distributed by MLS GRID
 - $269,9003 bd2 ba1.4k sqft3539 E Southport Rd, Indianapolis, IN 46227ActiveMLS ID #22111284, Michelle Anderson, Bold Realty LLC. MIBOR as distributed by MLS GRID
- $289,9995 bd2 ba2.9k sqft1405 Gilbert Ave, Indianapolis, IN 46227ActiveMLS ID #22105166, Anna Yazel, Maximum Results Real Estate. MIBOR as distributed by MLS GRID
- $269,9003 bd2 ba2.4k sqft7618 Mary Ln, Indianapolis, IN 46217ActiveMLS ID #22111889, Lora Reynolds, Epique Inc. MIBOR as distributed by MLS GRID
- $310,0004 bd2 ba2k sqft7115 W Ralston Rd, Indianapolis, IN 46221ActiveMLS ID #22109453, Lora Reynolds, Epique Inc. MIBOR as distributed by MLS GRID
- $355,0004 bd3 ba2.8k sqft6808 Harriet Dr, Indianapolis, IN 46237ActiveMLS ID #22107821, Jeannie Grant, Highgarden Real Estate. MIBOR as distributed by MLS GRID
- $265,0003 bd1 ba2k sqft6024 Orinoco Ave, Indianapolis, IN 46227ActiveMLS ID #22106196, Harold Davis, Janko Realty Group. MIBOR as distributed by MLS GRID
- $309,9003 bd3 ba1.7k sqft710 W Southport Rd, Indianapolis, IN 46217ActiveMLS ID #22108442, Lindsey Smalling, Highgarden Real Estate. MIBOR as distributed by MLS GRID
- $325,0003 bd2 ba1.6k sqft133 Jonquil Dr, Indianapolis, IN 46227ActiveMLS ID #22109193, David C Brenton, DAVID BRENTON'S TEAM. MIBOR as distributed by MLS GRID
- $305,0003 bd3 ba2.1k sqft5913 Winston Dr, Indianapolis, IN 46226ActiveMLS ID #22104918, Georgina Becerra, F.C. Tucker Company. MIBOR as distributed by MLS GRID
- $233,0003 bd2 ba1.4k sqft7824 E Hanna Ave, Indianapolis, IN 46239ActiveMLS ID #22105991, Lisanne Allen, Carpenter, REALTORS®. MIBOR as distributed by MLS GRID
- $279,9004 bd2 ba1.8k sqft129 N Sadlier Dr, Indianapolis, IN 46219ActiveMLS ID #22100307, Kylie Brooke, Epique Inc. MIBOR as distributed by MLS GRID
- $300,0003 bd2 ba1.6k sqft8847 Ash Rd, Indianapolis, IN 46234ActiveMLS ID #22112937, Curtis Holland, United Real Estate Indpls. MIBOR as distributed by MLS GRID
- $349,9004 bd2 ba2.2k sqft415 Meadowview Ln, Greenwood, IN 46142ActiveMLS ID #22113025, John Connor, Indyvestors Real Estate LLC. MIBOR as distributed by MLS GRID
- $275,9993 bd2 ba2.1k sqft8439 Trotter Rd, Camby, IN 46113ActiveMLS ID #22107549, Yadira Ramon Herrera, Mainstay Brokerage LLC. MIBOR as distributed by MLS GRID
- $399,0004 bd5 ba2.6k sqft54 Church St, Indianapolis, IN 46227ActiveMLS ID #22113431, Angela Resiak, Carpenter, REALTORS®. MIBOR as distributed by MLS GRID
- $299,9004 bd3 ba2k sqft3702 N Euclid Ave, Indianapolis, IN 46218ActiveMLS ID #22101754, Tom Farris, Carpenter, REALTORS®. MIBOR as distributed by MLS GRID
