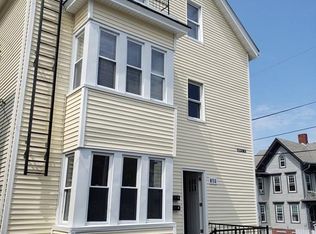
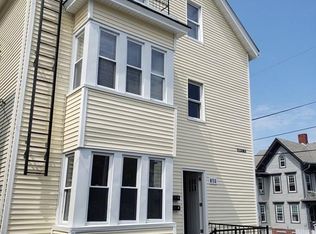
*****WATER VIEWS***** This spacious Fall River three-family offers nine bedrooms total, with three bedrooms and a spacious eat-in kitchen in each unit. The second-floor deck is a standout, with panoramic water views. Two units are currently vacant, giving buyers the flexibility to live in one or lease both.. Enjoy a short walk to the commuter rail and easy access to the waterfront and revitalized Route 79 corridor. With generous layouts and room to add value over time, this property is an appealing opportunity!
For sale
$777,888
498 Durfee St, Fall River, MA 02720
8beds
3,478sqft
3 Family
Built in 1900
-- sqft lot
$763,100 Zestimate®
$224/sqft
$-- HOA
What's special
Second-floor deckPanoramic water viewsNine bedrooms totalGenerous layouts
- 4 days
- 238
- 13
Zillow last checked:
Listing updated:
Listed by:
The Vision Group 401-648-1692,
Keller Williams South Watuppa 508-677-3233,
Drew Carline 401-648-1692
Source: MLS PIN,MLS#: 73602283
Facts & features
Interior
Bedrooms & bathrooms
- Bedrooms: 8
- Bathrooms: 3
- Full bathrooms: 3
Features
- Basement: Full
- Has fireplace: No
Interior area
- Total structure area: 3,478
- Total interior livable area: 3,478 sqft
- Finished area above ground: 3,478
Property
Features
- Patio & porch: Porch, Deck
- Has view: Yes
- View description: Scenic View(s)
Lot
- Size: 3,886 Square Feet
Details
- Parcel number: M:000O B:0014 L:0039,2834286
- Zoning: G
Construction
Type & style
- Home type: MultiFamily
- Property subtype: 3 Family
Materials
- Foundation: Stone
Condition
- Year built: 1900
Utilities & green energy
- Sewer: Public Sewer
- Water: Public
Community & HOA
Community
- Features: Public Transportation, Walk/Jog Trails, Highway Access, T-Station
Location
- Region: Fall River
Financial & listing details
- Price per square foot: $224/sqft
- Tax assessed value: $520,300
- Annual tax amount: $5,973
- Date on market: 11/14/2026
- Total actual rent: 1600
Estimated market value
$763,100
$725,000 - $801,000
$3,141/mo
Price history
| Date | Event | Price |
|---|---|---|
| 11/15/2026 | Listed for sale | $777,888+68.4%$224/sqft |
Source: MLS PIN #73602283 Report a problem | ||
| 5/8/2026 | Sold | $462,000+2.7%$133/sqft |
Source: MLS PIN #73496672 Report a problem | ||
| 4/14/2026 | Contingent | $449,900$129/sqft |
Source: MLS PIN #73496672 Report a problem | ||
| 4/6/2026 | Listed for sale | $449,900+125.1%$129/sqft |
Source: MLS PIN #73496672 Report a problem | ||
| 11/30/2018 | Listing removed | $199,900$57/sqft |
Source: Keller Williams Realty - South Watuppa #72386684 Report a problem | ||
| 8/31/2018 | Listed for sale | $199,900$57/sqft |
Source: Keller Williams South Watuppa #72386684 Report a problem | ||
Public tax history
| Year | Property taxes | Tax assessment |
|---|---|---|
| 2025 | $5,600 +4.5% | $489,100 +4.9% |
| 2024 | $5,359 +12.6% | $466,400 +20.2% |
| 2023 | $4,761 +13.5% | $388,000 +16.7% |
| 2022 | $4,196 +6.2% | $332,500 +16.4% |
| 2021 | $3,950 +11.6% | $285,600 +16.6% |
| 2020 | $3,539 +17% | $244,900 +18.1% |
| 2019 | $3,024 +10% | $207,400 +10.3% |
| 2018 | $2,749 +3.6% | $188,000 -0.8% |
| 2017 | $2,653 +2.4% | $189,500 -0.3% |
| 2016 | $2,590 +5.9% | $190,000 +1.6% |
| 2015 | $2,446 -3.5% | $187,000 -7.2% |
| 2014 | $2,536 +3.6% | $201,600 -1.8% |
| 2013 | $2,449 +6.3% | $205,300 -2.1% |
| 2012 | $2,303 +5.2% | $209,700 -13.5% |
| 2010 | $2,190 +0.3% | $242,300 -10.5% |
| 2009 | $2,183 -4.3% | $270,800 -8.9% |
| 2008 | $2,280 +8% | $297,200 +1.1% |
| 2007 | $2,111 +12.5% | $294,000 +7.1% |
| 2006 | $1,876 +0.5% | $274,600 +11.9% |
| 2005 | $1,867 +29.8% | $245,400 +40.1% |
| 2004 | $1,438 +9.4% | $175,100 +42.7% |
| 2003 | $1,314 +8.9% | $122,700 |
| 2002 | $1,207 -5.9% | $122,700 |
| 2000 | $1,283 +30.4% | $122,700 +14.5% |
| 1995 | $984 | $107,200 |
Find assessor info on the county website
Monthly payment
Est. payment
Payment breakdown
Explore the cost of this home by adjusting the details. Changes won't be saved.Climate risks
Neighborhood: Lower Highlands

Similar homes
- $710,0009 bd3 ba3.1k sqft70 Warburton St, Fall River, MA 02720For Sale
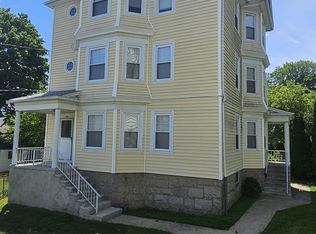 MLS ID #73556701, Karen Charette, First Choice Patenaude R.E.. MLS PIN
- $649,9008 bd3 ba3.5k sqft498 Tecumseh St, Fall River, MA 02721For Sale
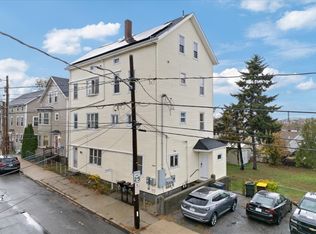 MLS ID #73600138, D. Brian Colville III, HomeSmart First Class Realty. MLS PIN
- $674,9996 bd3 ba2.6k sqft251 Cory St, Fall River, MA 02720For Sale
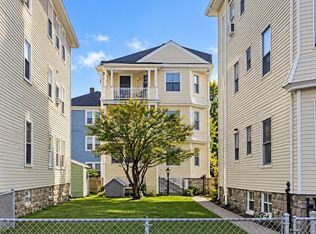 MLS ID #73576490, Michael Ferreira, Anchor Realty. MLS PIN
- $729,9998 bd4 ba3.1k sqft186 Fountain St, Fall River, MA 02721For Sale
 MLS ID #73555021, Sindy Barreau, MSC Realty Inc.. MLS PIN
- $599,9995 bd3 ba2.9k sqft32 Slater St, Fall River, MA 02720For Sale
 MLS ID #1418784, Lizbeth Rivera, eXp Realty. StateWide MLS RI
- $769,0006 bd3 ba4.4k sqft1699 Elmwood Ave, Warwick, RI 02888For SaleMLS ID #1428429, Yolanda Nazario, REMAX Revolution. StateWide MLS RI
