$52,000
-- bd|-- ba|-- sqft
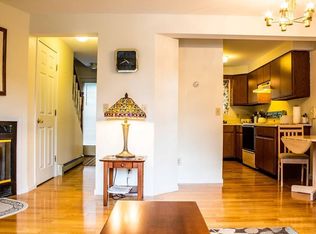
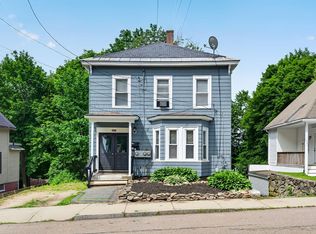
188 Gardner Rd, Hubbardston, MA 01452
Off Market
Zillow last checked:
Listing updated:
Dell Costa 508-294-8566,
Dell Realty Inc. 617-629-5950,
Daniela Barbosa 978-320-7536
$338,800
$322,000 - $356,000
$2,412/mo
| Date | Event | Price |
|---|---|---|
| 6/25/2026 | Listed for sale | $339,900+74.3%$247/sqft |
Source: MLS PIN #73541327 Report a problem | ||
| 9/10/2020 | Sold | $195,000+107.4%$142/sqft |
Source: Public Record Report a problem | ||
| 10/30/2012 | Sold | $94,000-5.9%$68/sqft |
Source: Public Record Report a problem | ||
| 8/7/2012 | Price change | $99,900-16.7%$73/sqft |
Source: Tebo Properties East DBA Keller Williams #71333612 Report a problem | ||
| 2/4/2012 | Listed for sale | $119,900-17.3%$87/sqft |
Source: Keller Williams Realty Greater Worcester #71333612 Report a problem | ||
| 12/14/2011 | Listing removed | $145,000$105/sqft |
Source: Foster-Healey Real Estate #71247852 Report a problem | ||
| 6/14/2011 | Listed for sale | $145,000-9.3%$105/sqft |
Source: Foster-Healey Real Estate #71247852 Report a problem | ||
| 8/29/2010 | Listing removed | $159,900$116/sqft |
Source: Brenda Cormier #70981109 Report a problem | ||
| 3/13/2010 | Price change | $159,900-5.9%$116/sqft |
Source: Brenda Cormier #70981109 Report a problem | ||
| 11/10/2009 | Listed for sale | $169,900$123/sqft |
Source: Brenda Cormier #70981109 Report a problem | ||
| 10/3/2009 | Listing removed | $169,900$123/sqft |
Source: Brenda Cormier #70981109 Report a problem | ||
| 9/28/2009 | Listed for sale | $169,900+95.3%$123/sqft |
Source: Brenda Cormier #70981109 Report a problem | ||
| 8/20/1999 | Sold | $87,000+20%$63/sqft |
Source: Public Record Report a problem | ||
| 7/30/1997 | Sold | $72,500+52.6%$53/sqft |
Source: Public Record Report a problem | ||
| 2/24/1995 | Sold | $47,500$34/sqft |
Source: Public Record Report a problem | ||
| Year | Property taxes | Tax assessment |
|---|---|---|
| 2025 | $2,920 +3.4% | $250,000 +4.4% |
| 2024 | $2,824 +19.6% | $239,500 +32.1% |
| 2023 | $2,362 -6.9% | $181,300 |
| 2022 | $2,538 -3.6% | $181,300 +2% |
| 2021 | $2,633 +21.2% | $177,800 +21.3% |
| 2020 | $2,173 +3% | $146,600 +5.8% |
| 2019 | $2,109 +4.8% | $138,600 +4.2% |
| 2018 | $2,012 -0.7% | $133,000 |
| 2017 | $2,026 -4.2% | $133,000 |
| 2016 | $2,115 +5.5% | $133,000 -1% |
| 2015 | $2,005 +0% | $134,400 -2.6% |
| 2014 | $2,004 +6.5% | $138,000 |
| 2013 | $1,882 +2.9% | $138,000 -4.2% |
| 2012 | $1,829 +9.5% | $144,000 -2.4% |
| 2011 | $1,671 -1.8% | $147,500 -7.3% |
| 2010 | $1,701 +2.2% | $159,100 -9.1% |
| 2009 | $1,664 +7.6% | $175,000 +6.6% |
| 2008 | $1,547 -2.7% | $164,100 |
| 2007 | $1,590 -8.8% | $164,100 -0.1% |
| 2006 | $1,743 +8.3% | $164,300 +9.9% |
| 2005 | $1,609 +10.4% | $149,500 +11.4% |
| 2004 | $1,457 +12.3% | $134,200 +48.9% |
| 2003 | $1,297 +6.9% | $90,100 +5.4% |
| 2001 | $1,213 | $85,500 |
Find assessor info on the county website
A local agent can set up tours, give advice and negotiate with sellers.
A local lender can help you make sure your offer is ready when you are.