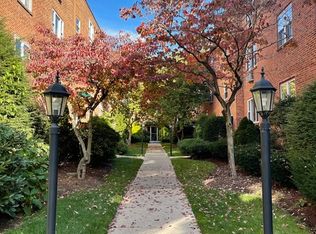
Deeded Parking spot with this 360 sq feet condo. No need to look for street parking. Large windows with great sunlight. Hardwood flooring. Low condo maintenance fees that includes parking and heat and hot water. Great for students or young professionals. One of the best locations in Brighton in a quiet courtyard, in a desirable Brighton neighborhood. Colborne Court Condominium also features in-ground pool and laundry. Just a short walk to Whole Foods, St. Elizabeth's Medical Center, the Green line T, buses (65, 501, and 503), shops and restaurants.
For sale by owner
$299,000
59 Colborne Rd APT B2, Brighton, MA 02135
1beds
360sqft
Condo
Built in 1963
-- sqft lot
$287,100 Zestimate®
$831/sqft
$211/mo HOA
What's special
In-ground poolHardwood flooringQuiet courtyard
- 17 minutes
- 5
- 0
Listed by:
Property Owner (978) 245-5885
Facts & features
Interior
Bedrooms & bathrooms
- Bedrooms: 1
- Bathrooms: 1
- Full bathrooms: 1
Heating
- None, Forced air
Cooling
- None
Appliances
- Included: Dishwasher, Garbage disposal, Range / Oven, Refrigerator
Features
- Flooring: Laminate
Interior area
- Total interior livable area: 360 sqft
Property
Parking
- Total spaces: 1
- Parking features: Off-street
Features
- Exterior features: Brick
Lot
- Size: 360 Square Feet
Details
- Parcel number: BRIGW21P01986S148
Construction
Type & style
- Home type: Condo
Condition
- New construction: No
- Year built: 1963
Community & HOA
HOA
- Has HOA: Yes
- HOA fee: $211 monthly
Location
- Region: Brighton
Financial & listing details
- Price per square foot: $831/sqft
- Tax assessed value: $271,700
- Annual tax amount: $3,146
- Date on market: 11/19/2026
Estimated market value
$287,100
$264,000 - $307,000
$1,849/mo
Price history
| Date | Event | Price |
|---|---|---|
| 11/19/2026 | Listed for sale | $299,000-6.6%$831/sqft |
Source: Owner Report a problem | ||
| 5/14/2023 | Listing removed | $320,000$889/sqft |
Source: MLS PIN #73088468 Report a problem | ||
| 3/16/2023 | Listed for sale | $320,000+171.8%$889/sqft |
Source: MLS PIN #73088468 Report a problem | ||
| 7/5/2020 | Listing removed | $1,400$4/sqft |
Source: Zillow Rental Manager Report a problem | ||
| 5/28/2020 | Price change | $1,400+4.5%$4/sqft |
Source: NextGen Realty Report a problem | ||
| 5/26/2020 | Listed for rent | $1,340-0.7%$4/sqft |
Source: Zillow Rental Manager Report a problem | ||
| 3/26/2020 | Listing removed | $1,350$4/sqft |
Source: NextGen Realty Report a problem | ||
| 2/24/2020 | Listed for rent | $1,350$4/sqft |
Source: Centre Realty Report a problem | ||
| 6/12/2019 | Listing removed | $1,350$4/sqft |
Source: Zillow Rental Manager Report a problem | ||
| 4/30/2019 | Listed for rent | $1,350+3.8%$4/sqft |
Source: Zillow Rental Manager Report a problem | ||
| 4/28/2017 | Listing removed | $1,300$4/sqft |
Source: Zillow Rental Manager Report a problem | ||
| 3/29/2017 | Listed for rent | $1,300$4/sqft |
Source: Zillow Rental Manager Report a problem | ||
| 6/17/2015 | Listing removed | $1,300$4/sqft |
Source: Chow Realty Report a problem | ||
| 5/2/2015 | Listed for rent | $1,300+5.3%$4/sqft |
Source: Chow Realty Report a problem | ||
| 5/15/2014 | Listing removed | $1,235-1.2%$3/sqft |
Source: Chow Realty Report a problem | ||
| 4/17/2014 | Price change | $1,250+1.2%$3/sqft |
Source: Prudential Unlimited Realty Report a problem | ||
| 4/4/2014 | Listed for rent | $1,235+2.9%$3/sqft |
Source: Chow Realty Report a problem | ||
| 8/2/2012 | Listing removed | $1,200$3/sqft |
Source: Modern Real Estate Report a problem | ||
| 7/31/2012 | Price change | $1,200-7.3%$3/sqft |
Source: Modern Real Estate Report a problem | ||
| 7/27/2012 | Listed for rent | $1,295+3.6%$4/sqft |
Source: Lee Cooper Report a problem | ||
| 5/30/2012 | Listing removed | $1,250$3/sqft |
Source: High End Apartments Report a problem | ||
| 5/11/2012 | Listed for rent | $1,250$3/sqft |
Source: High End Apartments Report a problem | ||
| 5/4/2011 | Sold | $117,750-10.1%$327/sqft |
Source: Public Record Report a problem | ||
| 12/29/2003 | Sold | $131,000+22.4%$364/sqft |
Source: Public Record Report a problem | ||
| 3/12/2001 | Sold | $107,000+151.8%$297/sqft |
Source: Public Record Report a problem | ||
| 5/1/1998 | Sold | $42,500$118/sqft |
Source: Public Record Report a problem | ||
Public tax history
| Year | Property taxes | Tax assessment |
|---|---|---|
| 2025 | $3,146 -4.8% | $271,700 -10.4% |
| 2024 | $3,306 +1.5% | $303,300 |
| 2023 | $3,257 +4.6% | $303,300 +6% |
| 2022 | $3,114 +2% | $286,200 |
| 2021 | $3,054 +38.6% | $286,200 +37.1% |
| 2020 | $2,204 +2.2% | $208,700 +2% |
| 2019 | $2,156 +7.5% | $204,600 +7% |
| 2018 | $2,005 +348.7% | $191,300 +8% |
| 2017 | $447 -75% | $177,100 +9% |
| 2016 | $1,788 +11.5% | $162,500 +22.7% |
| 2015 | $1,604 +5.9% | $132,440 +15% |
| 2013 | $1,514 -21% | $115,192 -21.6% |
| 2012 | $1,917 +9.7% | $147,000 +7.5% |
| 2011 | $1,748 +6.5% | $136,700 -1% |
| 2010 | $1,641 +23.7% | $138,100 +10.7% |
| 2009 | $1,327 -3.1% | $124,800 |
| 2008 | $1,369 -1.2% | $124,800 -1% |
| 2007 | $1,386 | $126,100 |
Find assessor info on the county website
Monthly payment
Est. payment
Payment breakdown
Explore the cost of this home by adjusting the details. Changes won't be saved.Climate risks
Neighborhood: Brighton



Similar homes
- $264,9901 bd1 ba360 sqftColborne Court Condominium, Brighton, MA 02135For Sale
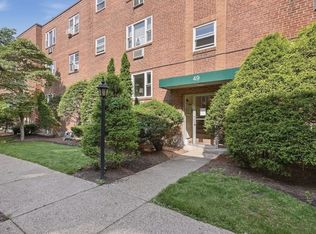 MLS ID #73549716, Lioce Properties Group, Lamacchia Realty, Inc.. MLS PIN
- $299,900-- bd1 ba306 sqftWashington Square Condominiums, Brighton, MA 02135For Sale
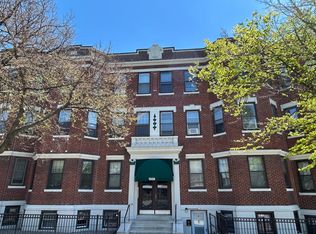 MLS ID #73579726, Gary J. Centurelli, Mass Bay Real Estate, LLC. MLS PIN
- $294,000-- bd1 ba297 sqft1840 Commonwealth Ave APT 8, Brighton, MA 02135For Sale
 MLS ID #73588027, Waypoint Realty Group, Coldwell Banker Realty - Boston. MLS PIN
- $310,000-- bd1 ba370 sqftReservoir Manor, Brighton, MA 02135For Sale
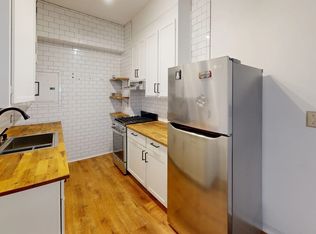 MLS ID #73594532, Nova Group, Hooli Homes Boston. MLS PIN
