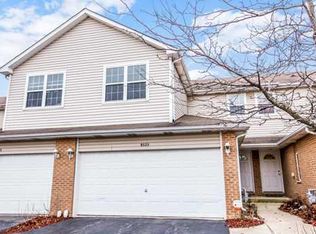
$300,000
2 bd|3 ba|-- sqft
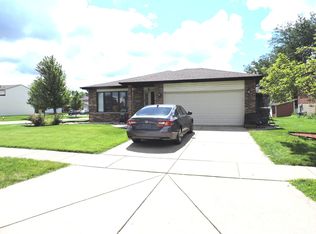
1807 Mager Dr, Tinley Park, IL 60487
Off Market
Zillow last checked:
Listing updated:
Stan Thomas 312-999-0217,
Brick Stone International Inc.
Not available
Estimated sales range
Not available
Not available
| Date | Event | Price |
|---|---|---|
| 4/1/2026 | Price change | $339,500-1.6%$189/sqft |
Source: | ||
| 3/16/2026 | Listed for sale | $345,000+81.6%$192/sqft |
Source: | ||
| 11/2/2018 | Sold | $190,000-7.3%$106/sqft |
Source: | ||
| 9/20/2018 | Pending sale | $204,900$114/sqft |
Source: Bowers Realty Group #10005312 Report a problem | ||
| 9/7/2018 | Price change | $204,900-1.9%$114/sqft |
Source: Bowers Realty Group #10005312 Report a problem | ||
| 8/3/2018 | Price change | $208,900-3.2%$116/sqft |
Source: Bowers Realty Group #10005312 Report a problem | ||
| 7/3/2018 | Listed for sale | $215,900+30.8%$120/sqft |
Source: Bowers Realty Group #10005312 Report a problem | ||
| 4/18/2014 | Listing removed | $165,000$92/sqft |
Source: Keller Williams Preferred #08491926 Report a problem | ||
| 3/27/2014 | Price change | $165,000-2.9%$92/sqft |
Source: Keller Williams Preferred #08491926 Report a problem | ||
| 2/1/2014 | Price change | $170,000-14.1%$94/sqft |
Source: All Dimensions Realty, Inc. #08491926 Report a problem | ||
| 12/15/2013 | Price change | $198,000-0.5%$110/sqft |
Source: All Dimensions Realty, Inc. #08491926 Report a problem | ||
| 12/3/2013 | Listed for sale | $199,000+18.8%$111/sqft |
Source: All Dimensions Realty, Inc. #08491926 Report a problem | ||
| 5/2/2002 | Sold | $167,500$93/sqft |
Source: Public Record Report a problem | ||
| Year | Property taxes | Tax assessment |
|---|---|---|
| 2023 | $6,749 +10.3% | $24,307 +41.7% |
| 2022 | $6,117 +3.3% | $17,158 |
| 2021 | $5,920 +2.7% | $17,158 |
| 2020 | $5,766 -7.2% | $17,158 -10.4% |
| 2019 | $6,213 +24.5% | $19,156 |
| 2018 | $4,989 +2.3% | $19,156 |
| 2017 | $4,875 +1.6% | $19,156 +13.1% |
| 2016 | $4,798 +2% | $16,943 |
| 2015 | $4,705 +0.5% | $16,943 |
| 2014 | $4,683 +2.4% | $16,943 -4.7% |
| 2013 | $4,575 +2.1% | $17,777 |
| 2012 | $4,481 +2.3% | $17,777 |
| 2011 | $4,379 +3.5% | $17,777 -7.1% |
| 2010 | $4,231 +11.1% | $19,126 -5.4% |
| 2009 | $3,810 +6.4% | $20,211 -5% |
| 2008 | $3,580 +3.7% | $21,275 +12.1% |
| 2007 | $3,452 -17.6% | $18,982 |
| 2006 | $4,188 +4.3% | $18,982 |
| 2005 | $4,014 +24.1% | $18,982 +25.8% |
| 2004 | $3,235 +10.2% | $15,094 |
| 2003 | $2,937 | $15,094 +377.7% |
| 2001 | -- | $3,160 |
Find assessor info on the county website
Source: MRED as distributed by MLS GRID. This data may not be complete. We recommend contacting the local school district to confirm school assignments for this home.
A local agent can set up tours, give advice and negotiate with sellers.