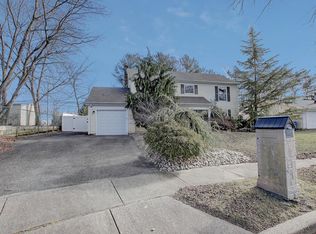
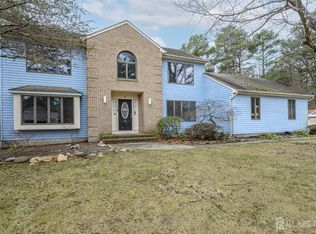
4 bedroom, 1 bathroom single-family home in rentable condition.
Brand new septic system
Public water
.41 Acre lot Zoned R15 (double the size of adjacent Harfield neighborhood lots with same zoning)
Located near planned project, which will be pulling sewer to the property. May allow future development flexibility (buyer to do due diligence)
Good buy-and-hold property with potential upside.
Sold as-is.
Please do not solicit me for listing services.
For sale by owner
$519,000
82 N New Prospect Rd, Jackson, NJ 08527
4beds
1baths
1,754sqft
SingleFamily
Built in 1939
0.41 Acres Lot
$714,300 Zestimate®
$296/sqft
$-- HOA
Overview
- 51 days |
- 518 |
- 8 |
Listed by:
Property Owner (646) 599-2305
Facts & features
Interior
Bedrooms & bathrooms
- Bedrooms: 4
- Bathrooms: 1
Heating
- Radiant
Cooling
- None
Appliances
- Included: Dryer, Washer
Features
- Flooring: Hardwood
- Basement: Partially finished
- Has fireplace: No
Interior area
- Total interior livable area: 1,754 sqft
Property
Parking
- Parking features: None
Features
- Exterior features: Other
Lot
- Size: 0.41 Acres
Details
- Parcel number: 1205804000000015
Construction
Type & style
- Home type: SingleFamily
- Architectural style: Colonial
Materials
- Other
- Foundation: Concrete
- Roof: Asphalt
Condition
- New construction: No
- Year built: 1939
Community & HOA
Location
- Region: Jackson
Financial & listing details
- Price per square foot: $296/sqft
- Tax assessed value: $253,700
- Annual tax amount: $6,553
- Date on market: 5/18/2026
Estimated market value
$714,300
$629,000 - $814,000
$3,471/mo
Price history
| Date | Event | Price |
|---|---|---|
| 6/13/2026 | Listed for sale | $519,000-23.1%$296/sqft |
Source: Owner Report a problem | ||
| 4/26/2026 | Listing removed | $3,450$2/sqft |
Source: Zillow Rentals Report a problem | ||
| 3/31/2026 | Listed for rent | $3,450-1.4%$2/sqft |
Source: Zillow Rentals Report a problem | ||
| 7/23/2025 | Listing removed | $3,500$2/sqft |
Source: Zillow Rentals Report a problem | ||
| 6/13/2025 | Price change | $3,500+6.1%$2/sqft |
Source: Zillow Rentals Report a problem | ||
| 5/16/2025 | Price change | $3,300-8.3%$2/sqft |
Source: Zillow Rentals Report a problem | ||
| 4/24/2025 | Listed for rent | $3,600+6%$2/sqft |
Source: Zillow Rentals Report a problem | ||
| 12/9/2024 | Sold | $675,000+170%$385/sqft |
Source: Public Record Report a problem | ||
| 4/23/2023 | Listing removed | -- |
Source: Zillow Rentals Report a problem | ||
| 3/16/2023 | Listed for rent | $3,395+47.9%$2/sqft |
Source: Zillow Rentals Report a problem | ||
| 3/24/2021 | Listing removed | -- |
Source: Owner Report a problem | ||
| 3/3/2020 | Listing removed | $2,295$1/sqft |
Source: Owner Report a problem | ||
| 12/1/2019 | Listed for rent | $2,295+27.5%$1/sqft |
Source: Owner Report a problem | ||
| 6/24/2019 | Sold | $250,000+165.7%$143/sqft |
Source: Public Record Report a problem | ||
| 2/20/2018 | Listing removed | $1,800$1/sqft |
Source: Zillow Rental Manager Report a problem | ||
| 2/5/2018 | Listed for rent | $1,800$1/sqft |
Source: Zillow Rental Manager Report a problem | ||
| 6/25/2017 | Listing removed | $1,800$1/sqft |
Source: Zillow Rental Manager Report a problem | ||
| 6/13/2017 | Listed for rent | $1,800$1/sqft |
Source: Owner Report a problem | ||
| 1/23/2017 | Sold | $94,100$54/sqft |
Source: Public Record Report a problem | ||
Public tax history
| Year | Property taxes | Tax assessment |
|---|---|---|
| 2023 | $6,553 +2% | $253,700 |
| 2022 | $6,426 | $253,700 |
| 2021 | $6,426 +2.6% | $253,700 |
| 2020 | $6,261 +2.6% | $253,700 |
| 2019 | $6,101 +2.5% | $253,700 |
| 2018 | $5,954 +1.7% | $253,700 |
| 2017 | $5,853 +2.1% | $253,700 |
| 2016 | $5,734 +2.7% | $253,700 |
| 2015 | $5,581 +2.7% | $253,700 |
| 2014 | $5,434 +3.7% | $253,700 |
| 2013 | $5,239 -3.8% | $253,700 |
| 2012 | $5,445 +6.3% | $253,700 -5.1% |
| 2011 | $5,124 +3.1% | $267,300 |
| 2010 | $4,972 +26.8% | $267,300 |
| 2009 | $3,922 +3.1% | $267,300 +179.3% |
| 2008 | $3,805 | $95,700 +1.2% |
| 2007 | -- | $94,600 |
| 2006 | $3,427 | $94,600 |
| 2004 | -- | $94,600 |
| 2003 | -- | $94,600 |
| 2002 | -- | $94,600 |
| 2001 | -- | $94,600 |
Find assessor info on the county website
Monthly payment
Est. payment$--/mo
Payment breakdown
Explore the cost of this home by adjusting the details. Changes won't be saved.All calculations are estimates and provided by Zillow, Inc. for informational purposes only. Actual amounts may vary.
HOA fees may include property taxes on listings classified as Co-Ops. Contact the listing agent and/or owner for fee details.
Mortgage interest rates are dependent on a number of factors, including credit score, down payment, and repayment length. Interest rate data provided by Zillow Group Marketplace, Inc. as of 1/1/1970 from various mortgage lenders with which we have lead or other similar arrangements; the Estimated Payment is an average of those rates.
See how much you could borrow to make a competitive offer.
Climate risks
Neighborhood: Edgewood Park
Nearby schools
GreatSchools rating
- 5/10Howard C Johnson Elementary SchoolGrades: PK-5Distance: 0.3 mi
- 5/10Carl W Goetz Middle SchoolGrades: 6-8Distance: 6.5 mi
- 5/10Jackson Memorial High SchoolGrades: PK,9-12Distance: 4.8 mi
A local agent can set up tours, give advice and negotiate with sellers.
A local lender can help you make sure your offer is ready when you are.


- New Jersey
- Ocean County
- Jackson
- 08527
- Edgewood Park
- 82 N New Prospect Rd
Nearby cities
Nearby neighborhoods
Nearby zip codes
Other Jackson Topics
