$759,400
3 bd|2 ba|1.2k sqft
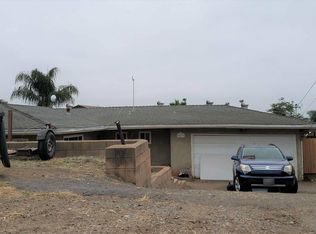
9233 Harness St, Spring Valley, CA 91977
Off Market
Zillow last checked:
Listing updated:
Melody Parra DRE #02114671 fatherdaughterpower@gmail.com,
LPT Realty, Inc.
$451,100
$429,000 - $474,000
$3,686/mo
| Date | Event | Price |
|---|---|---|
| 5/21/2026 | Pending sale | $430,000+156.7%$373/sqft |
Source: | ||
| 10/13/2011 | Sold | $167,500+1.5%$145/sqft |
Source: Public Record Report a problem | ||
| 8/26/2011 | Price change | $165,000-4.6%$143/sqft |
Source: CFL Realty #100023001 Report a problem | ||
| 5/13/2011 | Price change | $173,000-1.1%$150/sqft |
Source: Realty Corp Report a problem | ||
| 5/5/2011 | Price change | $175,000+2.9%$152/sqft |
Source: Realty Corp Report a problem | ||
| 4/29/2011 | Listed for sale | $170,000+3%$147/sqft |
Source: Realty Corp Report a problem | ||
| 2/5/2011 | Listing removed | $165,000$143/sqft |
Source: CFL Realty #100023001 Report a problem | ||
| 1/22/2011 | Price change | $165,000-5.7%$143/sqft |
Source: CFL Realty #100023001 Report a problem | ||
| 1/15/2011 | Price change | $175,000+2.9%$152/sqft |
Source: CFL Realty #100023001 Report a problem | ||
| 1/9/2011 | Price change | $170,000-8.1%$147/sqft |
Source: CFL Realty #100023001 Report a problem | ||
| 10/8/2010 | Price change | $185,000-2.6%$160/sqft |
Source: CFL Realty #100023001 Report a problem | ||
| 10/1/2010 | Price change | $190,000-2.6%$165/sqft |
Source: CFL Realty #100023001 Report a problem | ||
| 9/23/2010 | Price change | $195,000-2.5%$169/sqft |
Source: CFL Realty #100023001 Report a problem | ||
| 9/10/2010 | Listed for sale | $200,000-53.4%$173/sqft |
Source: CFL Realty #100023001 Report a problem | ||
| 8/24/2005 | Sold | $429,000+166.5%$372/sqft |
Source: Public Record Report a problem | ||
| 6/1/2005 | Sold | $161,000$140/sqft |
Source: Public Record Report a problem | ||
| Year | Property taxes | Tax assessment |
|---|---|---|
| 2025 | $3,137 +5.2% | $210,378 +2% |
| 2024 | $2,983 +3.5% | $206,254 +2% |
| 2023 | $2,882 +2.1% | $202,211 +2% |
| 2022 | $2,824 +0.9% | $198,247 +2% |
| 2021 | $2,800 +4.5% | $194,360 +1% |
| 2020 | $2,680 +27.5% | $192,368 +2% |
| 2019 | $2,102 -17.3% | $188,597 +2% |
| 2018 | $2,543 +3.1% | $184,900 +2% |
| 2017 | $2,466 +0.8% | $181,275 +2% |
| 2016 | $2,447 +0.9% | $177,722 +1.5% |
| 2015 | $2,426 +1.7% | $175,053 +2% |
| 2014 | $2,386 | $171,625 +0.5% |
| 2013 | -- | $170,850 +2% |
| 2012 | -- | $167,500 -34.3% |
| 2011 | -- | $255,000 |
| 2010 | -- | $255,000 -44% |
| 2009 | -- | $455,257 +2% |
| 2008 | -- | $446,331 +2% |
| 2007 | -- | $437,580 +2% |
| 2006 | -- | $429,000 +1041.1% |
| 2005 | -- | $37,596 +2% |
| 2004 | -- | $36,860 +1.9% |
| 2003 | -- | $36,185 +2% |
| 2002 | -- | $35,476 +2% |
| 2001 | -- | $34,782 |
Find assessor info on the county website
Source: CRMLS. This data may not be complete. We recommend contacting the local school district to confirm school assignments for this home.
A local agent can set up tours, give advice and negotiate with sellers.
Local buyer's agents are ready to help