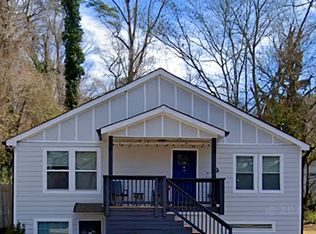
INVESTMENT OPPORTUNITY | FULLY RENTED | $3,500/MONTH INCOME Welcome to 99 Holly Road NW, a 5-bedroom, 3-bathroom income-producing property in Atlanta's established Westside community. The property is fully rented with yearly leases in place, generating a combined $3,500 per month in rental income. Unit A rents for $2,000/month and Unit B rents for $1,500/month. Tenants are responsible for all utilities, helping reduce the owner's operating expenses. Conveniently located near major Atlanta roadways, shopping, dining, schools, parks, and entertainment. An excellent opportunity for an investor seeking an income-producing property with established tenants and rental income from day one.
Active
$425,000
99 Holly Rd NW, Atlanta, GA 30314
5beds
3baths
--sqft
Multi Family, Duplex
Built in 1947
-- sqft lot
$406,600 Zestimate®
$--/sqft
$-- HOA
What's special
- 34 days
- 1,252
- 177
Zillow last checked:
Listing updated:
Listed by:
RYAN DEPERALTO 215-980-5599,
Dalton Wade, Inc.
Source: GAMLS,MLS#: 10854111
Facts & features
Interior
Bedrooms & bathrooms
- Bedrooms: 5
- Bathrooms: 3
Heating
- Central
Cooling
- Ceiling Fan(s), Central Air
Features
- Basement: Bath Finished,Exterior Entry,Finished
- Has fireplace: No
Property
Parking
- Parking features: Parking Pad
- Has uncovered spaces: Yes
Features
- Levels: Two
- Stories: 2
Lot
- Size: 0.31 Acres
Details
- Parcel number: 14 014700050166
- Special conditions: Agent Owned
Construction
Type & style
- Home type: MultiFamily
- Property subtype: Multi Family, Duplex
Materials
- Wood Siding
Condition
- Updated/Remodeled
- New construction: No
- Year built: 1947
Utilities & green energy
- Sewer: Public Sewer
- Water: Public
- Utilities for property: Sewer Connected
Community & HOA
Community
- Features: None
- Subdivision: None
HOA
- Has HOA: No
- Services included: None
Location
- Region: Atlanta
Financial & listing details
- Tax assessed value: $458,800
- Annual tax amount: $3,334
- Date on market: 9/27/2026
- Cumulative days on market: 34 days
- Listing agreement: Exclusive Right To Sell
- Listing terms: Cash,Conventional,Private Financing Available
Estimated market value
$406,600
$386,000 - $427,000
$2,389/mo
Price history
| Date | Event | Price |
|---|---|---|
| 9/28/2026 | Listed for sale | $425,000+74% |
Source:  GAMLS #10854111 Report a problem | ||
| 7/24/2026 | Sold | $244,230 |
Source: GAMLS #10770616 Report a problem | ||
| 6/9/2026 | Pending sale | $244,230 |
Source: GAMLS #10770616 Report a problem | ||
| 5/23/2026 | Listed for sale | $244,230-52.6% |
Source: GAMLS #10770616 Report a problem | ||
| 7/30/2025 | Listing removed | $514,900 |
Source:  FMLS GA #7616323 Report a problem | ||
| 7/16/2025 | Listed for sale | $514,900-1% |
Source: FMLS GA #7616323 Report a problem | ||
| 12/3/2024 | Listing removed | $519,900 |
Source: FMLS GA #7469135 Report a problem | ||
| 11/1/2024 | Price change | $519,9000% |
Source: GAMLS #10392809 Report a problem | ||
| 10/9/2024 | Price change | $520,000-3.5% |
Source: FMLS GA #7469135 Report a problem | ||
| 7/29/2024 | Price change | $539,000-3.6% |
Source: FMLS GA #7365486 Report a problem | ||
| 5/29/2024 | Price change | $558,990-0.2% |
Source: GAMLS #10278179 Report a problem | ||
| 4/8/2024 | Listed for sale | $559,9000% |
Source: FMLS GA #7365486 Report a problem | ||
| 12/11/2023 | Listing removed | $560,000 |
Source: FMLS GA #7282241 Report a problem | ||
| 10/20/2023 | Price change | $560,000-1.8% |
Source: FMLS GA #7282241 Report a problem | ||
| 10/2/2023 | Listed for sale | $570,000+10.7% |
Source: FMLS GA #7282241 Report a problem | ||
| 5/9/2022 | Sold | $515,000 |
Source: FMLS GA #7003319 Report a problem | ||
| 4/27/2022 | Pending sale | $515,000 |
Source: GAMLS #20019377 Report a problem | ||
| 3/17/2022 | Price change | $515,000-1.9% |
Source: FMLS GA #7003319 Report a problem | ||
| 2/15/2022 | Listed for sale | $525,000+288.9% |
Source: FMLS GA #7003319 Report a problem | ||
| 2/12/2021 | Sold | $135,000+350% |
Source: Public Record Report a problem | ||
| 10/5/2017 | Sold | $30,000+275% |
Source: Public Record Report a problem | ||
| 8/10/2012 | Sold | $8,000-68% |
Source:  FMLS GA #4310304 Report a problem | ||
| 4/8/2011 | Listing removed | $25,000 |
Source: Better Homes and Gardens Real Estate Metro Brokers #4173755 Report a problem | ||
| 4/3/2011 | Pending sale | $25,000 |
Source: Better Homes and Gardens Real Estate Metro Brokers #4173755 Report a problem | ||
| 1/29/2011 | Listed for sale | $25,000 |
Source: Better Homes and Gardens Real Estate Metro Brokers #4173755 Report a problem | ||
Public tax history
| Year | Property taxes | Tax assessment |
|---|---|---|
| 2025 | $3,334 -0.8% | $183,520 +2.9% |
| 2024 | $3,362 +29.2% | $178,400 |
| 2023 | $2,603 +32.8% | $178,400 +268.3% |
| 2022 | $1,960 +60.5% | $48,440 +63% |
| 2021 | $1,221 +9.1% | $29,720 +9.9% |
| 2020 | $1,119 +39.4% | $27,040 +82.2% |
| 2019 | $803 | $14,840 +98.4% |
| 2018 | $803 | $7,480 +6.9% |
| 2017 | $803 +0.9% | $7,000 |
| 2016 | $795 +0.8% | $7,000 |
| 2015 | $789 +148.6% | $7,000 |
| 2014 | $317 +126.2% | $7,000 +120.1% |
| 2013 | $140 | $3,180 -67.4% |
| 2012 | -- | $9,760 -34.1% |
| 2011 | $21 +11.3% | $14,800 |
| 2010 | $19 -16.2% | $14,800 -28% |
| 2009 | $22 | $20,560 -20.1% |
| 2008 | -- | $25,720 +24.9% |
| 2007 | -- | $20,600 |
| 2005 | -- | $20,600 +3% |
| 2004 | -- | $20,000 +2.9% |
| 2003 | -- | $19,440 +0.6% |
| 2002 | -- | $19,320 +13.6% |
| 2001 | $17 | $17,000 |
Find assessor info on the county website
Monthly payment
Est. payment
Payment breakdown
Explore the cost of this home by adjusting the details. Changes won't be saved.Climate risks
Neighborhood: Hunter Hills
Nearby schools
Schools provided by the listing agent
- Elementary: F L Stanton
- Middle: J L Invictus
- High: Douglass
Source: GAMLS. This data may not be complete. We recommend contacting the local school district to confirm school assignments for this home.
Similar homes
- $524,9003 bd3 ba2.4k sqft1466 Norris Pl NW, Atlanta, GA 30314Active
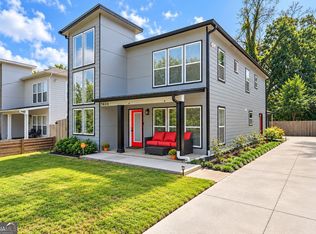
 MLS ID #10868429, Meka Wilson, Keller Williams Atlanta Midtown. GAMLS
- $378,0005 bd4 ba-- sqft996 Parsons St SW, Atlanta, GA 30314Active
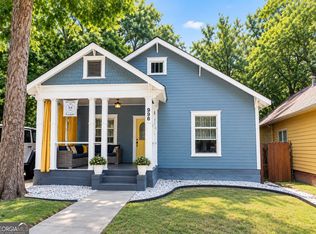 MLS ID #10868446, Quinn Shealey, Homesouth Residential Inc. GAMLS
- $375,0003 bd3 ba1.6k sqft1401 Mims St SW, Atlanta, GA 30314Active
 MLS ID #10825920, Justin Landis, Bolst. GAMLS
- $389,9994 bd4 ba-- sqft177 Silver Springs Cir SW, Atlanta, GA 30310Active
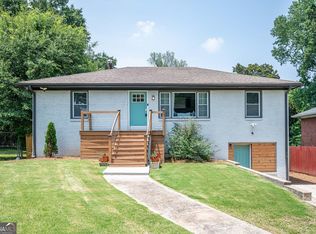 MLS ID #10836350, Olaniyi Adewole, eXp Realty. GAMLS
- $399,0003 bd2 ba1.3k sqft973 Parsons St SW, Atlanta, GA 30314ActiveMLS ID #10711401, Jeff Raw, Keller Williams Realty. GAMLS
- $399,0004 bd3 ba1.6k sqft445 Griffin St, Atlanta, GA 30318ActiveMLS ID #10881559, Travis Stroud, Virtual Properties Realty.com. GAMLS
- $355,0005 bd3 ba3.2k sqft2933 Shelly Dr SW, Atlanta, GA 30311ActiveMLS ID #10832189, Alex Hulsey, Simple Showing Inc. GAMLS
- $339,9003 bd2 ba2.5k sqft664 Clover St SW, Atlanta, GA 30310ActiveMLS ID #10881249, Bru B Krebs III, BHHS Georgia Properties. GAMLS
- $325,0003 bd3 ba1.7k sqft1888 Joseph E Boone Blvd NW, Atlanta, GA 30314ActiveMLS ID #10857597, David Garrison, Bolst. GAMLS
- $380,0003 bd3 ba1.7k sqft185 Wadley St NW, Atlanta, GA 30314For Sale
 MLS ID #7835261, Pierre Reeves, Keller Williams Realty West Atlanta. FMLS GA
- $315,0005 bd3 ba2.7k sqft2830 Allegro Dr NW, Atlanta, GA 30318ActiveMLS ID #10870091, Mark Spain, Mark Spain Real Estate. GAMLS
- $280,0003 bd2 ba1.3k sqft1579 Mozley Pl SW, Atlanta, GA 30314ActiveMLS ID #10818018, Jacquelyn Griffith, Keller Williams West Atlanta. GAMLS
- $378,9005 bd3 ba2.7k sqft852 Norwood Rd SE, Atlanta, GA 30315ActiveMLS ID #10790622, Tanisha Augustus, Norluxe Realty. GAMLS
- $610,0005 bd4 ba3.6k sqft2600 Lisa Dr SW, Atlanta, GA 30311ActiveMLS ID #10857542, Tabitha Daniel, SouthOwens Realty. GAMLS
- $289,9993 bd2 ba1.4k sqft665 S Eugenia Pl NW, Atlanta, GA 30318ActiveMLS ID #10873143, Shoy Cooper, Century 21 Results. GAMLS
- $375,0003 bd2 ba2.1k sqft1236 Avon Ave SW, Atlanta, GA 30310ActiveMLS ID #10826566, Tammy Soulakos, Keller Williams Realty Atl. Partners. GAMLS
- $359,9003 bd2 ba1.2k sqft1654 Hadlock St SW, Atlanta, GA 30311ActiveMLS ID #10853523, Tommy Williams, Bailey Heritage Homes. GAMLS
- $377,0003 bd2 ba1.5k sqft1770 S Olympian Way SW, Atlanta, GA 30310ActiveMLS ID #10728019, Dana Link, Atlanta InTown Real Estate. GAMLS
- $475,0004 bd3 ba2.3k sqft1840 Wells Dr SW, Atlanta, GA 30311ActiveMLS ID #10856497, Jackie Rollizo, Compass. GAMLS
