$95,870
5 Acres
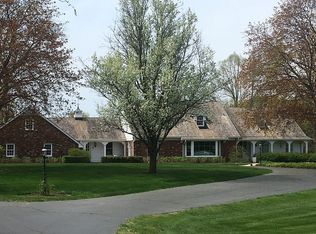
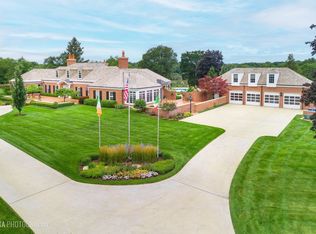
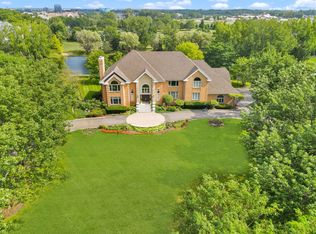
414 Dana Ln, Barrington, IL 60010
Off Market
Zillow last checked: 7 hours ago
Listing updated: March 30, 2026 at 09:54am
John Morrison, SFR 847-409-0297,
@properties Christie's International Real Estate
Not available
Estimated sales range
Not available
Not available
| Date | Event | Price |
|---|---|---|
| 3/30/2026 | Listed for sale | $3,750,000+27.1%$331/sqft |
Source: | ||
| 6/28/2022 | Sold | $2,950,000-9.2%$260/sqft |
Source: | ||
| 5/27/2022 | Pending sale | $3,250,000$287/sqft |
Source: | ||
| 5/27/2022 | Contingent | $3,250,000$287/sqft |
Source: | ||
| 4/14/2022 | Price change | $3,250,000-4.4%$287/sqft |
Source: | ||
| 6/18/2021 | Listed for sale | $3,400,000+54.5%$300/sqft |
Source: BHHS Chicago #11116209 Report a problem | ||
| 6/5/2012 | Sold | $2,200,000-43.6%$194/sqft |
Source: | ||
| 9/15/2011 | Price change | $3,900,000-13.1%$344/sqft |
Source: ERA Countrywood Realty #07230887 Report a problem | ||
| 4/8/2011 | Price change | $4,490,000-4.4%$396/sqft |
Source: ERA Countrywood Realty #07230887 Report a problem | ||
| 3/3/2011 | Price change | $4,695,000-1.9%$414/sqft |
Source: ERA Countrywood Realty #07230887 Report a problem | ||
| 2/18/2011 | Price change | $4,785,000-2.1%$422/sqft |
Source: BIRDVIEW Technologies. Inc. #07230887 Report a problem | ||
| 1/16/2010 | Listed for sale | $4,890,000-7.1%$432/sqft |
Source: BIRDVIEW Technologies. Inc. #07230887 Report a problem | ||
| 11/30/2009 | Listing removed | $5,265,000$465/sqft |
Source: ERA #1127523 Report a problem | ||
| 3/21/2008 | Listed for sale | $5,265,000$465/sqft |
Source: ERA #1127523 Report a problem | ||
| 1/18/2008 | Listing removed | $5,265,000$465/sqft |
Source: ERA #1127523 Report a problem | ||
| 11/12/2007 | Listed for sale | $5,265,000$465/sqft |
Source: ERA #1127523 Report a problem | ||
| Year | Property taxes | Tax assessment |
|---|---|---|
| 2023 | $52,688 +4% | $219,999 |
| 2022 | $50,638 +67.3% | $219,999 +89% |
| 2021 | $30,274 -7.1% | $116,411 -9.4% |
| 2020 | $32,583 -2.3% | $128,501 -14.3% |
| 2019 | $33,339 +3.2% | $150,027 +5.3% |
| 2018 | $32,304 -6.6% | $142,486 -8.4% |
| 2017 | $34,579 -5.9% | $155,563 -10.3% |
| 2016 | $36,745 +8.8% | $173,377 +21.4% |
| 2015 | $33,772 -5.1% | $142,807 -5.1% |
| 2014 | $35,573 -29.1% | $150,510 -31.6% |
| 2013 | $50,205 +10.1% | $220,000 +5.8% |
| 2012 | $45,592 +6.6% | $207,990 |
| 2011 | $42,762 +2.3% | $207,990 |
| 2010 | $41,786 -4.8% | $207,990 -10.3% |
| 2009 | $43,905 +9% | $231,933 -4% |
| 2008 | $40,263 -0.6% | $241,597 |
| 2007 | $40,517 -5.1% | $241,597 -1% |
| 2006 | $42,713 +814.4% | $244,158 +810.3% |
| 2005 | $4,671 -27.5% | $26,823 -31.8% |
| 2002 | $6,443 -18.7% | $39,350 -35.3% |
| 2001 | $7,927 +6% | $60,788 +9.9% |
| 2000 | $7,476 +8.7% | $55,309 |
| 1999 | $6,879 | $55,309 |
Source: MRED as distributed by MLS GRID. This data may not be complete. We recommend contacting the local school district to confirm school assignments for this home.