$311,800
3 bd|2 ba|1.3k sqft
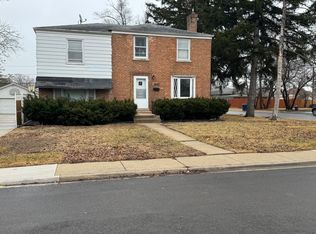
1551 N Taft Ave, Berkeley, IL 60163
Off Market
Likely to sell faster than
Zillow last checked: 8 hours ago
Listing updated: March 05, 2026 at 03:03pm
Araceli Solis (773)425-8169,
eXp Realty
$288,600
$274,000 - $303,000
$2,576/mo
| Date | Event | Price |
|---|---|---|
| 3/3/2026 | Listed for sale | $290,000+9.6%$259/sqft |
Source: | ||
| 5/9/2023 | Sold | $264,500$236/sqft |
Source: | ||
| 4/5/2023 | Contingent | $264,500$236/sqft |
Source: | ||
| 3/31/2023 | Listed for sale | $264,500-21%$236/sqft |
Source: | ||
| 7/7/2013 | Listing removed | $1,875$2/sqft |
Source: CENTURY 21 T.K. Realty, Inc. #08272939 Report a problem | ||
| 3/4/2013 | Price change | $1,875-5.1%$2/sqft |
Source: Century 21 TK Realty #08272939 Report a problem | ||
| 2/19/2013 | Listed for rent | $1,975$2/sqft |
Source: Century 21 TK Realty #08272939 Report a problem | ||
| 10/6/2007 | Listing removed | $335,000$299/sqft |
Source: Owner Report a problem | ||
| 2/26/2007 | Listed for sale | $335,000+101.8%$299/sqft |
Source: Owner Report a problem | ||
| 7/24/2002 | Sold | $166,000+21.6%$148/sqft |
Source: Public Record Report a problem | ||
| 12/4/1998 | Sold | $136,500$122/sqft |
Source: Public Record Report a problem | ||
| Year | Property taxes | Tax assessment |
|---|---|---|
| 2023 | $8,522 +17.4% | $22,999 +39.2% |
| 2022 | $7,259 +0.3% | $16,523 |
| 2021 | $7,236 +6% | $16,523 |
| 2020 | $6,824 +33.7% | $16,523 +37.2% |
| 2019 | $5,103 +2% | $12,040 |
| 2018 | $5,003 -11.7% | $12,040 -15.6% |
| 2017 | $5,667 +29.8% | $14,266 +32.2% |
| 2016 | $4,367 +0.3% | $10,788 |
| 2015 | $4,354 +1.8% | $10,788 |
| 2014 | $4,275 -18.6% | $10,788 -24.8% |
| 2013 | $5,250 +28% | $14,339 |
| 2012 | $4,101 -0.8% | $14,339 |
| 2011 | $4,133 -8.1% | $14,339 -31% |
| 2010 | $4,498 +10.3% | $20,791 |
| 2009 | $4,079 +8.5% | $20,791 -5% |
| 2008 | $3,758 +3.2% | $21,886 +16.7% |
| 2007 | $3,642 +3% | $18,758 |
| 2006 | $3,536 +7.6% | $18,758 |
| 2005 | $3,287 +0% | $18,758 +27.7% |
| 2004 | $3,286 +0.5% | $14,687 |
| 2003 | $3,270 +4.9% | $14,687 |
| 2002 | $3,118 +8.4% | $14,687 +19.8% |
| 2001 | $2,876 +6.6% | $12,257 |
| 2000 | $2,699 +26.9% | $12,257 |
| 1999 | $2,127 | $12,257 |
Source: MRED as distributed by MLS GRID. This data may not be complete. We recommend contacting the local school district to confirm school assignments for this home.