$186,300
3 bd|1 ba|1.9k sqft
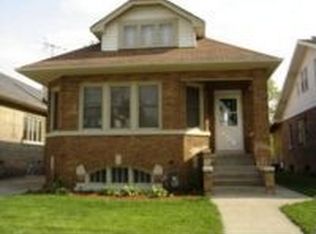
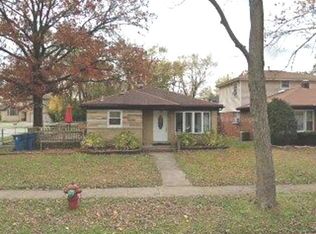
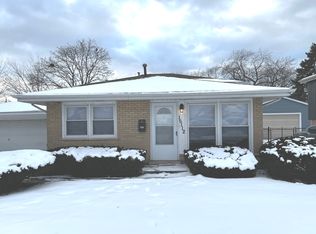
2525 Cochran St, Blue Island, IL 60406
Off Market
Zillow last checked:
Listing updated:
Colleen Berg 888-276-9959,
Berg Properties
$264,400
$251,000 - $278,000
$2,261/mo
| Date | Event | Price |
|---|---|---|
| 3/18/2026 | Contingent | $269,000$168/sqft |
Source: | ||
| 3/13/2026 | Listed for sale | $269,000$168/sqft |
Source: | ||
| 2/18/2026 | Contingent | $269,000$168/sqft |
Source: | ||
| 1/10/2026 | Price change | $269,000-3.6%$168/sqft |
Source: | ||
| 12/19/2025 | Listed for sale | $279,000+469.4%$174/sqft |
Source: | ||
| 9/8/2010 | Sold | $49,000-1.8%$31/sqft |
Source: | ||
| 6/7/2010 | Listing removed | $49,900$31/sqft |
Source: Vflyer #07396808 Report a problem | ||
| 5/27/2010 | Price change | $49,900-13.8%$31/sqft |
Source: Vflyer #07396808 Report a problem | ||
| 5/26/2010 | Listed for sale | $57,900$36/sqft |
Source: Vflyer #07396808 Report a problem | ||
| 4/10/2010 | Listing removed | $57,900-20.1%$36/sqft |
Source: TheListingWidget.com #07396808 Report a problem | ||
| 3/8/2010 | Price change | $72,500-25.9%$45/sqft |
Source: TheListingWidget.com #07396808 Report a problem | ||
| 12/18/2009 | Listed for sale | $97,900-34.7%$61/sqft |
Source: TheListingWidget.com #07396808 Report a problem | ||
| 5/11/2009 | Listing removed | $150,000$94/sqft |
Source: Homes.com #07046881 Report a problem | ||
| 11/5/2008 | Listed for sale | $150,000+6%$94/sqft |
Source: Homes.com #07046881 Report a problem | ||
| 7/19/2004 | Sold | $141,500-2.4%$88/sqft |
Source: Public Record Report a problem | ||
| 5/27/2003 | Sold | $145,000$91/sqft |
Source: Public Record Report a problem | ||
| Year | Property taxes | Tax assessment |
|---|---|---|
| 2023 | $7,397 +25.5% | $18,999 +53.9% |
| 2022 | $5,896 +6% | $12,349 |
| 2021 | $5,561 +2.8% | $12,349 |
| 2020 | $5,408 -0.2% | $12,349 +2.6% |
| 2019 | $5,422 +4.6% | $12,033 |
| 2018 | $5,182 -1.2% | $12,033 |
| 2017 | $5,247 +25.2% | $12,033 +31.1% |
| 2016 | $4,191 -4.7% | $9,176 -7.3% |
| 2015 | $4,397 -8.5% | $9,896 -10.2% |
| 2014 | $4,806 +18.6% | $11,026 +10% |
| 2013 | $4,052 +4.1% | $10,020 |
| 2012 | $3,892 -5.4% | $10,020 -10.2% |
| 2011 | $4,115 -24.1% | $11,152 -29.9% |
| 2010 | $5,420 +1.1% | $15,919 |
| 2009 | $5,361 +11.3% | $15,919 -5% |
| 2008 | $4,817 +13.9% | $16,756 +16.8% |
| 2007 | $4,229 +6.7% | $14,352 |
| 2006 | $3,962 +3.2% | $14,352 |
| 2005 | $3,838 +24.9% | $14,352 +28.2% |
| 2004 | $3,074 +4.2% | $11,197 |
| 2003 | $2,951 +25.6% | $11,197 |
| 2002 | $2,349 +18.7% | $11,197 +12.2% |
| 2001 | $1,979 +6.8% | $9,983 |
| 2000 | $1,852 +2% | $9,983 |
| 1999 | $1,815 | $9,983 |
Source: MRED as distributed by MLS GRID. This data may not be complete. We recommend contacting the local school district to confirm school assignments for this home.
A local agent can set up tours, give advice and negotiate with sellers.
A local lender can help you make sure your offer is ready when you are.