$2,097,100
5 bd|5 ba|4.1k sqft
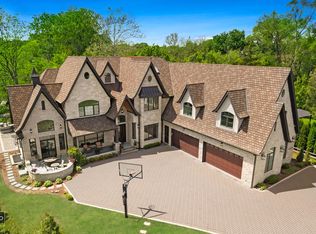
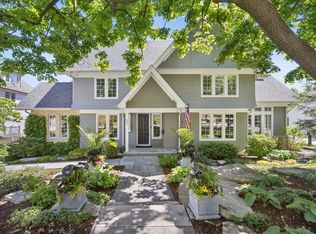
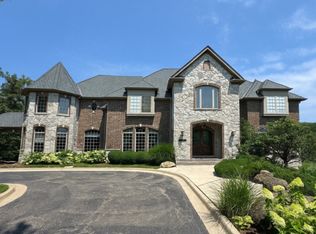
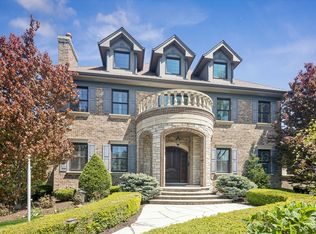
9 Andrew Ct, Burr Ridge, IL 60527
Off Market
Zillow last checked:
Listing updated:
Neringa Koller, ABR,PSA,SRS 630-901-8988,
REMAX Legends
Not available
Estimated sales range
Not available
Not available
| Date | Event | Price |
|---|---|---|
| 6/8/2026 | Listed for sale | $2,640,000+297%$264/sqft |
Source: MRED as distributed by MLS GRID #12658628 Report a problem | ||
| 5/12/2020 | Sold | $665,000-17.3%$67/sqft |
Source: | ||
| 2/27/2020 | Pending sale | $804,500$80/sqft |
Source: Americas Best Realty Inc. #10541279 Report a problem | ||
| 2/25/2020 | Price change | $804,500-2.5%$80/sqft |
Source: Americas Best Realty Inc. #10541279 Report a problem | ||
| 1/22/2020 | Price change | $824,900-5.8%$82/sqft |
Source: Americas Best Realty Inc. #10541279 Report a problem | ||
| 12/19/2019 | Price change | $875,900-3.8%$88/sqft |
Source: Americas Best Realty Inc. #10541279 Report a problem | ||
| 11/26/2019 | Price change | $910,500-1%$91/sqft |
Source: Americas Best Realty Inc. #10541279 Report a problem | ||
| 10/8/2019 | Listed for sale | $919,900-8%$92/sqft |
Source: Americas Best Realty Inc. #10541279 Report a problem | ||
| 4/12/2019 | Listing removed | $1,000,000$100/sqft |
Source: Compass #10131229 Report a problem | ||
| 1/7/2019 | Price change | $1,000,000-25.9%$100/sqft |
Source: Compass #10131229 Report a problem | ||
| 11/6/2018 | Price change | $1,350,000-20.6%$135/sqft |
Source: Compass #10131229 Report a problem | ||
| 9/21/2018 | Listed for sale | $1,699,900+529.6%$170/sqft |
Source: Compass #10090277 Report a problem | ||
| 9/5/1995 | Sold | $270,000$27/sqft |
Source: Public Record Report a problem | ||
| Year | Property taxes | Tax assessment |
|---|---|---|
| 2024 | $36,878 +4.9% | $655,008 +8.8% |
| 2023 | $35,156 +173.2% | $602,140 +163.3% |
| 2022 | $12,868 +4.7% | $228,730 +1.1% |
| 2021 | $12,289 -0.3% | $226,130 +2% |
| 2020 | $12,323 -62.1% | $221,650 |
| 2019 | $32,477 +1.1% | -- |
| 2018 | $32,139 +3% | $578,480 +3.9% |
| 2017 | $31,206 +1.6% | $556,660 +4.8% |
| 2016 | $30,717 -0.2% | $531,260 +6.3% |
| 2015 | $30,790 +9.4% | $499,820 +11.5% |
| 2014 | $28,142 +0.9% | $448,310 +0.5% |
| 2013 | $27,899 -1% | $446,220 -4.3% |
| 2012 | $28,180 +5.2% | $466,310 -6.1% |
| 2011 | $26,791 +10.2% | $496,600 -1.3% |
| 2010 | $24,301 +4% | $503,130 -5.8% |
| 2009 | $23,362 +2.4% | $534,050 |
| 2008 | $22,808 +2.9% | $534,050 +5.9% |
| 2007 | $22,165 -1.6% | $504,300 |
| 2006 | $22,519 +2.1% | $504,300 +7.7% |
| 2005 | $22,065 -1.1% | $468,240 +7% |
| 2004 | $22,304 +11.1% | $437,610 +10% |
| 2003 | $20,075 +7.4% | $397,820 +13.2% |
| 2002 | $18,699 +10.3% | $351,450 +6.8% |
| 2001 | $16,960 +8.6% | $329,180 +10.4% |
| 2000 | $15,619 | $298,080 |
Source: MRED as distributed by MLS GRID. This data may not be complete. We recommend contacting the local school district to confirm school assignments for this home.
A local agent can set up tours, give advice and negotiate with sellers.