$599,100
-- bd|-- ba|-- sqft
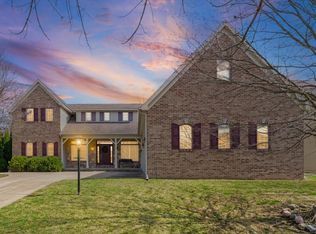
2103 Crossgate Ct, Champaign, IL 61822
Off Market
Zillow last checked:
Listing updated:
Jacob Patterson 217-714-5393,
Realty Select One
Not available
Estimated sales range
Not available
Not available
| Date | Event | Price |
|---|---|---|
| 6/12/2026 | Listed for sale | $549,900+3.4%$179/sqft |
Source: MRED as distributed by MLS GRID #12666516 Report a problem | ||
| 6/9/2023 | Sold | $532,000+1.3%$174/sqft |
Source: | ||
| 4/11/2023 | Contingent | $525,000$171/sqft |
Source: | ||
| 4/3/2023 | Listed for sale | $525,000+52.2%$171/sqft |
Source: | ||
| 6/10/2019 | Sold | $345,000-1%$113/sqft |
Source: | ||
| 4/11/2019 | Pending sale | $348,500$114/sqft |
Source: Keller Williams Realty The Real Estate Center #10311775 Report a problem | ||
| 3/25/2019 | Listed for sale | $348,500+6.7%$114/sqft |
Source: KELLER WILLIAMS-TREC #10311775 Report a problem | ||
| 2/14/2014 | Sold | $326,500-2.5%$106/sqft |
Source: Agent Provided Report a problem | ||
| 12/26/2013 | Price change | $335,000+5%$109/sqft |
Source: Keller Williams Realty - The Real Estate Center of Illinois, LLC. #2136574 Report a problem | ||
| 8/18/2013 | Listed for sale | $319,000$104/sqft |
Source: Owner Report a problem | ||
| Year | Property taxes | Tax assessment |
|---|---|---|
| 2024 | $10,278 +5.2% | $122,480 +8.3% |
| 2023 | $9,772 +5.3% | $113,090 +7.2% |
| 2022 | $9,277 +2.5% | $105,500 +1.8% |
| 2021 | $9,055 +1% | $103,630 +1% |
| 2020 | $8,970 | $102,600 +1.7% |
| 2019 | -- | $100,890 |
| 2018 | -- | $100,890 |
| 2017 | $8,696 +10.5% | $100,890 +1.2% |
| 2016 | $7,872 | $99,710 |
| 2015 | $7,872 +3.5% | $99,710 +4.9% |
| 2014 | $7,608 +0.9% | $95,060 |
| 2013 | $7,541 +3.6% | $95,060 |
| 2012 | $7,276 +1.9% | $95,060 |
| 2011 | $7,140 +1.4% | $95,060 -3.6% |
| 2010 | $7,041 | $98,580 -2.1% |
| 2009 | -- | $100,700 |
| 2008 | -- | $100,700 +1.1% |
| 2007 | $6,973 +0.9% | $99,600 +2.3% |
| 2006 | $6,913 +6.5% | $97,330 +5.3% |
| 2005 | $6,493 +33.8% | $92,420 +2.3% |
| 2004 | $4,852 +2.8% | $90,340 +5.5% |
| 2003 | $4,720 +0.9% | $85,660 +1.6% |
| 2002 | $4,678 +3.8% | $84,310 +3.5% |
| 2001 | $4,507 +3.3% | $81,460 +3.6% |
| 2000 | $4,365 | $78,630 |
Source: MRED as distributed by MLS GRID. This data may not be complete. We recommend contacting the local school district to confirm school assignments for this home.
A local agent can set up tours, give advice and negotiate with sellers.