$159,400
6 bd|2 ba|2.3k sqft
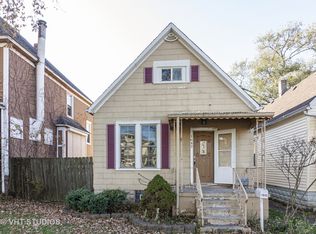
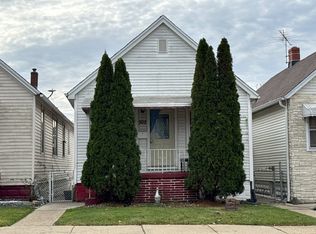
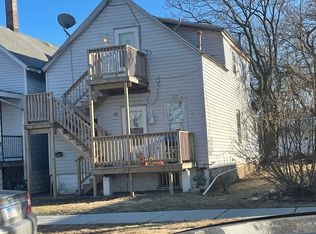
1652 Aberdeen St, Chicago Heights, IL 60411
Off Market
Zillow last checked:
Listing updated:
Jeremy Slowinski, CRS 708-670-2032,
Ellsbury Group LLC
Not available
Estimated sales range
Not available
Not available
| Date | Event | Price |
|---|---|---|
| 1/7/2026 | Listed for sale | $239,000-11.4% |
Source: | ||
| 11/3/2025 | Listing removed | $269,900 |
Source: | ||
| 10/8/2025 | Price change | $269,900-1.8% |
Source: | ||
| 10/3/2025 | Price change | $274,8000% |
Source: | ||
| 9/26/2025 | Price change | $274,900-1.8% |
Source: | ||
| 9/2/2025 | Listed for sale | $279,900+33.3% |
Source: | ||
| 8/1/2022 | Sold | $210,000-2.3% |
Source: | ||
| 6/22/2022 | Contingent | $214,900 |
Source: | ||
| 6/15/2022 | Listed for sale | $214,900+258.2% |
Source: | ||
| 11/1/2017 | Sold | $60,000-7.6% |
Source: | ||
| 10/13/2017 | Pending sale | $64,900 |
Source: RE/MAX 2000 #09687980 Report a problem | ||
| 9/16/2017 | Listed for sale | $64,900 |
Source: RE/MAX 2000 #09687980 Report a problem | ||
| 7/20/2017 | Pending sale | $64,900 |
Source: RE/MAX 2000 #09687980 Report a problem | ||
| 7/13/2017 | Price change | $64,900+12.1% |
Source: RE/MAX 2000 #09687980 Report a problem | ||
| 3/14/2017 | Pending sale | $57,900 |
Source: RE/MAX 2000 #09471593 Report a problem | ||
| 11/8/2016 | Price change | $57,900-3.3% |
Source: RE/MAX 2000 #09269516 Report a problem | ||
| 8/10/2016 | Price change | $59,900-7.7% |
Source: RE/MAX 2000 #09269516 Report a problem | ||
| 6/27/2016 | Listed for sale | $64,900-7.2% |
Source: RE/MAX 2000 #09269516 Report a problem | ||
| 9/8/2012 | Listing removed | $69,900 |
Source: RE/MAX All Properties #8115672 Report a problem | ||
| 8/1/2012 | Listed for sale | $69,900 |
Source: RE/MAX All Properties #8115672 Report a problem | ||
| Year | Property taxes | Tax assessment |
|---|---|---|
| 2023 | $8,918 +86.6% | $16,775 +121.9% |
| 2022 | $4,778 +4.1% | $7,560 |
| 2021 | $4,588 +3.3% | $7,560 |
| 2020 | $4,442 +28.6% | $7,560 +26% |
| 2019 | $3,455 +5.2% | $6,000 |
| 2018 | $3,285 -58.1% | $6,000 -59.9% |
| 2017 | $7,833 +21.4% | $14,965 +24.4% |
| 2016 | $6,452 +1.1% | $12,032 |
| 2015 | $6,379 +0.9% | $12,032 |
| 2014 | $6,322 -5.9% | $12,032 -9.4% |
| 2013 | $6,721 +3.2% | $13,284 |
| 2012 | $6,512 +9.7% | $13,284 |
| 2011 | $5,937 -13.6% | $13,284 -22.6% |
| 2010 | $6,870 +3.5% | $17,167 |
| 2009 | $6,640 +14.8% | $17,167 -5% |
| 2008 | $5,786 +0.8% | $18,071 +5.3% |
| 2007 | $5,740 -0.2% | $17,155 |
| 2006 | $5,750 +0.4% | $17,155 |
| 2005 | $5,729 +34.7% | $17,155 +36.1% |
| 2004 | $4,254 +3.2% | $12,603 |
| 2003 | $4,122 -5.8% | $12,603 |
| 2002 | $4,374 +7.9% | $12,603 +7.9% |
| 2001 | $4,053 +1% | $11,678 |
| 2000 | $4,015 +0% | $11,678 |
| 1999 | $4,015 | $11,678 |
Source: MRED as distributed by MLS GRID. This data may not be complete. We recommend contacting the local school district to confirm school assignments for this home.
A local agent can set up tours, give advice and negotiate with sellers.
A local lender can help you make sure your offer is ready when you are.