$149,000
-- bd|1 ba|525 sqft
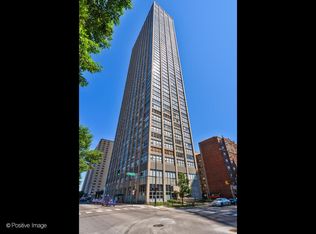
4343 N Clarendon Ave APT 401, Chicago, IL 60613
Sold

Zillow last checked:
Listing updated:
Walker Robinson (773)425-0881,
RE/MAX Premier
Not available
Estimated sales range
Not available
$2,094/mo
| Date | Event | Price |
|---|---|---|
| 4/16/2026 | Listed for sale | $165,000-4.3%$194/sqft |
Source: | ||
| 1/22/2026 | Listing removed | $172,500$203/sqft |
Source: | ||
| 1/5/2026 | Contingent | $172,500$203/sqft |
Source: | ||
| 1/5/2026 | Listed for sale | $172,500-1.4%$203/sqft |
Source: | ||
| 8/21/2025 | Listing removed | $175,000$206/sqft |
Source: | ||
| 7/14/2025 | Listed for sale | $175,000$206/sqft |
Source: | ||
| 12/31/2024 | Listing removed | $1,750+1.4%$2/sqft |
Source: Zillow Rentals Report a problem | ||
| 12/12/2024 | Price change | $1,725-1.4%$2/sqft |
Source: Zillow Rentals Report a problem | ||
| 11/25/2024 | Price change | $1,750-1.4%$2/sqft |
Source: Zillow Rentals Report a problem | ||
| 11/21/2024 | Price change | $1,775-1.4%$2/sqft |
Source: Zillow Rentals Report a problem | ||
| 11/4/2024 | Listed for rent | $1,800$2/sqft |
Source: Zillow Rentals Report a problem | ||
| Year | Property taxes | Tax assessment |
|---|---|---|
| 2023 | $3,398 +2.6% | $15,551 |
| 2022 | $3,312 +2.1% | $15,551 |
| 2021 | $3,243 +6.2% | $15,551 +17.5% |
| 2020 | $3,055 +0.6% | $13,237 -9.3% |
| 2019 | $3,037 +1.7% | $14,589 |
| 2018 | $2,985 +8.4% | $14,589 +18% |
| 2017 | $2,754 +7.7% | $12,366 |
| 2016 | $2,556 +9.1% | $12,366 |
| 2015 | $2,344 +27.1% | $12,366 +28.2% |
| 2014 | $1,845 +5.1% | $9,647 |
| 2013 | $1,755 -3.7% | $9,647 -5% |
| 2012 | $1,822 -12.9% | $10,154 -21.4% |
| 2011 | $2,093 -11.8% | $12,916 -11.5% |
| 2010 | $2,374 +1.8% | $14,587 -2.4% |
| 2009 | $2,331 +3.1% | $14,946 -5.1% |
| 2008 | $2,260 +1% | $15,755 |
| 2007 | $2,238 -1.1% | $15,755 |
| 2006 | $2,262 +12.2% | $15,755 +27.7% |
| 2005 | $2,015 +1% | $12,334 |
| 2004 | $1,995 +2.2% | $12,334 |
| 2003 | $1,952 +49.9% | $12,334 +70.2% |
| 2002 | $1,302 +3.8% | $7,246 |
| 2001 | $1,255 +27.9% | $7,246 |
| 2000 | $981 | $7,246 +41.9% |
| 1999 | $981 | $5,107 |
Source: MRED as distributed by MLS GRID. This data may not be complete. We recommend contacting the local school district to confirm school assignments for this home.
A local agent can set up tours, give advice and negotiate with sellers.