$490,000
2 bd|2 ba|1.2k sqft
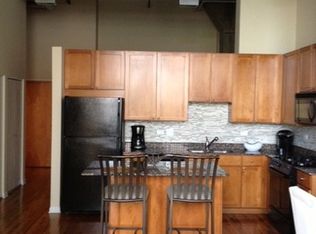
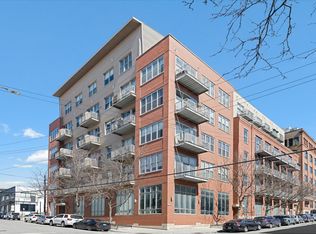
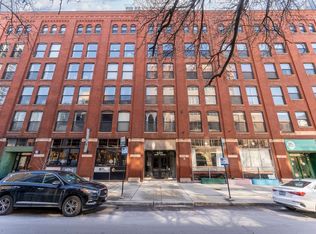
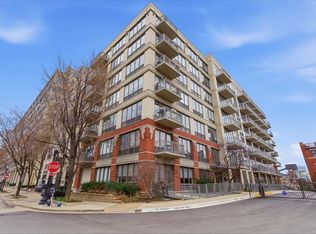
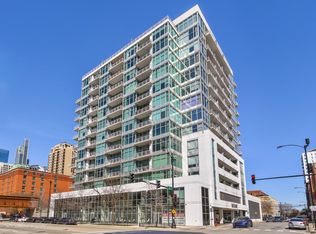
758 N Larrabee St APT 203, Chicago, IL 60654
Sold

Zillow last checked: 7 hours ago
Listing updated: 9 hours ago
Dennis Huyck 312-420-1593,
Keller Williams ONEChicago
$279,600
$266,000 - $294,000
$2,670/mo
| Date | Event | Price |
|---|---|---|
| 4/7/2026 | Listed for sale | $275,000 |
Source: | ||
| 11/14/2025 | Listing removed | $275,000 |
Source: | ||
| 10/28/2025 | Listed for sale | $275,000 |
Source: | ||
| 10/28/2025 | Listing removed | $275,000 |
Source: | ||
| 9/8/2025 | Listed for sale | $275,000 |
Source: | ||
| 5/15/2025 | Listing removed | $275,000 |
Source: | ||
| 4/30/2025 | Listed for sale | $275,000 |
Source: | ||
| 4/30/2025 | Listing removed | $275,000 |
Source: | ||
| 3/3/2025 | Listed for sale | $275,000 |
Source: | ||
| 3/3/2025 | Listing removed | $275,000 |
Source: | ||
| 2/12/2025 | Listed for sale | $275,000-5.2% |
Source: | ||
| 4/16/2019 | Sold | $290,000+9.4% |
Source: | ||
| 3/4/2019 | Pending sale | $265,000 |
Source: RE/MAX Vision 212 #10292184 Report a problem | ||
| 2/28/2019 | Listed for sale | $265,000+14.7% |
Source: RE/MAX Vision 212 #10292184 Report a problem | ||
| 6/24/2015 | Sold | $231,000+2.7% |
Source: | ||
| 5/2/2015 | Pending sale | $224,900 |
Source: @properties #08891200 Report a problem | ||
| 4/15/2015 | Price change | $224,900-4.3% |
Source: @properties #08891200 Report a problem | ||
| 3/9/2015 | Listing removed | $1,825 |
Source: Dream Town Realty #08809132 Report a problem | ||
| 3/9/2015 | Listed for sale | $234,900+20.5% |
Source: @properties #08891200 Report a problem | ||
| 1/5/2015 | Listed for rent | $1,825 |
Source: Dream Town Realty #08809132 Report a problem | ||
| 6/2/2012 | Listing removed | $194,900 |
Source: @properties #07969195 Report a problem | ||
| 1/6/2012 | Listed for sale | $194,900-6.5% |
Source: @properties #07969195 Report a problem | ||
| 10/7/2002 | Sold | $208,500 |
Source: Public Record Report a problem | ||
| Year | Property taxes | Tax assessment |
|---|---|---|
| 2023 | $4,829 +2.6% | $22,889 |
| 2022 | $4,708 +2.3% | $22,889 |
| 2021 | $4,603 -0.4% | $22,889 +10.4% |
| 2020 | $4,620 +20.5% | $20,737 -7.9% |
| 2019 | $3,834 +1.7% | $22,513 |
| 2018 | $3,768 +19.4% | $22,513 +24.8% |
| 2017 | $3,155 +1.4% | $18,033 |
| 2016 | $3,112 -5.8% | $18,033 |
| 2015 | $3,304 +18.4% | $18,033 +19.9% |
| 2014 | $2,791 +2% | $15,040 |
| 2013 | $2,735 +1.4% | $15,040 |
| 2012 | $2,699 +6.3% | $15,040 -4% |
| 2011 | $2,538 -0.4% | $15,665 |
| 2010 | $2,549 -12.3% | $15,665 -16% |
| 2009 | $2,908 +21.3% | $18,650 +11.6% |
| 2008 | $2,398 +1% | $16,717 |
| 2007 | $2,374 -1.1% | $16,717 |
| 2006 | $2,400 -0.7% | $16,717 +13.1% |
| 2005 | $2,416 +1% | $14,783 |
| 2004 | $2,391 +2.2% | $14,783 |
| 2003 | $2,339 | $14,783 |
Source: MRED as distributed by MLS GRID. This data may not be complete. We recommend contacting the local school district to confirm school assignments for this home.