$509,100
2 bd2 ba1.3k sqft
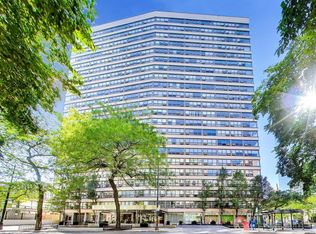
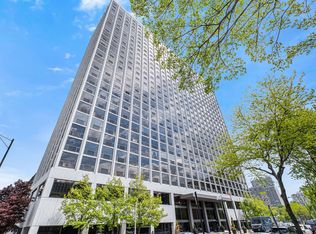
3150 N Lake Shore Dr APT 3A, Chicago, IL 60657
Off Market

Listing description withheld by the listing agent.
Zillow last checked:
Listing updated:
Dan Nelson (773)295-1751,
Compass

Not available
Estimated sales range
Not available
Not available
| Date | Event | Price |
|---|---|---|
| 11/4/2026 | Listed for sale | $245,000+28.9%$280/sqft |
Source:  MRED as distributed by MLS GRID #12794917 Report a problem | ||
| 7/23/2024 | Listing removed | -- |
Source: Zillow Rentals Report a problem | ||
| 7/12/2024 | Price change | $2,150-2.3%$2/sqft |
Source: Zillow Rentals Report a problem | ||
| 7/1/2024 | Price change | $2,200-4.3%$3/sqft |
Source: Zillow Rentals Report a problem | ||
| 6/22/2024 | Listed for rent | $2,300+43.8%$3/sqft |
Source: Zillow Rentals Report a problem | ||
| 9/9/2022 | Sold | $190,000-4.8%$217/sqft |
Source: MRED as distributed by MLS GRID #11473486 Report a problem | ||
| 8/15/2022 | Pending sale | $199,500$228/sqft |
Source:  Berkshire Hathaway HomeServices Chicago #11473486 Report a problem | ||
| 8/15/2022 | Contingent | $199,500$228/sqft |
Source: MRED as distributed by MLS GRID #11473486 Report a problem | ||
| 7/25/2022 | Listed for sale | $199,500$228/sqft |
Source: MRED as distributed by MLS GRID #11473486 Report a problem | ||
| 7/22/2022 | Pending sale | $199,500$228/sqft |
Source: Berkshire Hathaway HomeServices Chicago #11460218 Report a problem | ||
| 7/22/2022 | Contingent | $199,500$228/sqft |
Source: MRED as distributed by MLS GRID #11460218 Report a problem | ||
| 7/11/2022 | Listed for sale | $199,500+10.9%$228/sqft |
Source: MRED as distributed by MLS GRID #11460218 Report a problem | ||
| 5/18/2021 | Listing removed | -- |
Source: MRED as distributed by MLS GRID #11015259 Report a problem | ||
| 4/22/2021 | Price change | $179,900-2.8%$206/sqft |
Source: MRED as distributed by MLS GRID #11015259 Report a problem | ||
| 4/3/2021 | Price change | $185,000-2.1%$212/sqft |
Source: MRED as distributed by MLS GRID #11015259 Report a problem | ||
| 3/22/2021 | Price change | $189,000-3.1%$216/sqft |
Source: MRED as distributed by MLS GRID #11015259 Report a problem | ||
| 3/9/2021 | Listed for sale | $195,000+5.4%$223/sqft |
Source: MRED as distributed by MLS GRID #11015259 Report a problem | ||
| 2/24/2021 | Listing removed | -- |
Source:  MRED as distributed by MLS GRID Report a problem | ||
| 10/17/2020 | Price change | $185,000-7%$212/sqft |
Source: Kale Realty #10878388 Report a problem | ||
| 10/8/2020 | Price change | $199,000-5.2%$228/sqft |
Source: Kale Realty #10878388 Report a problem | ||
| 9/22/2020 | Listed for sale | $210,000+51.6%$240/sqft |
Source: Kale Realty #10878388 Report a problem | ||
| 8/30/2020 | Listing removed | $1,600$2/sqft |
Source: @properties #10523758 Report a problem | ||
| 8/17/2020 | Price change | $1,600-5.9%$2/sqft |
Source: @properties #10523758 Report a problem | ||
| 7/14/2020 | Listed for rent | $1,700$2/sqft |
Source: @properties #10523758 Report a problem | ||
| 1/10/2014 | Sold | $138,500$158/sqft |
Source: MRED as distributed by MLS GRID #08465646 Report a problem | ||
| Year | Property taxes | Tax assessment |
|---|---|---|
| 2024 | $4,074 +7.3% | $20,431 +13.5% |
| 2023 | $3,798 +2.6% | $17,999 |
| 2022 | $3,702 +2.3% | $17,999 |
| 2021 | $3,619 -2.1% | $17,999 +8.4% |
| 2020 | $3,698 +1.2% | $16,599 -8.7% |
| 2019 | $3,653 +1.7% | $18,181 |
| 2018 | $3,591 +6.1% | $18,181 +15.6% |
| 2017 | $3,386 +7.5% | $15,727 |
| 2016 | $3,150 +9.3% | $15,727 |
| 2015 | $2,882 +11.9% | $15,727 +13.3% |
| 2014 | $2,575 +2% | $13,881 |
| 2013 | $2,525 +46.5% | $13,881 |
| 2012 | $1,723 -0.4% | $13,881 -1.2% |
| 2011 | $1,730 -20.8% | $14,044 -14.7% |
| 2010 | $2,185 +5.2% | $16,460 -2% |
| 2009 | $2,077 +10.7% | $16,800 +3.3% |
| 2008 | $1,876 -0.5% | $16,268 |
| 2007 | $1,886 +42.6% | $16,268 |
| 2006 | $1,323 -16.8% | $16,268 +5.1% |
| 2005 | $1,590 +1.9% | $15,479 |
| 2004 | $1,560 +4.5% | $15,479 |
| 2003 | $1,494 -5.4% | $15,479 +45.9% |
| 2002 | $1,579 +6.2% | $10,612 |
| 2001 | $1,487 +50.5% | $10,612 |
| 2000 | $988 -28.5% | $10,612 +48.5% |
| 1999 | $1,382 | $7,144 |
Source: MRED as distributed by MLS GRID. This data may not be complete. We recommend contacting the local school district to confirm school assignments for this home.
A local agent can set up tours, give advice and negotiate with sellers.