$352,700
-- bd|1 ba|1.1k sqft
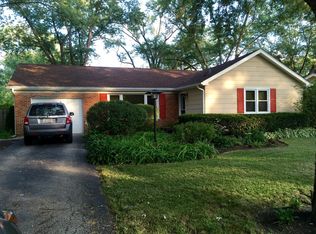
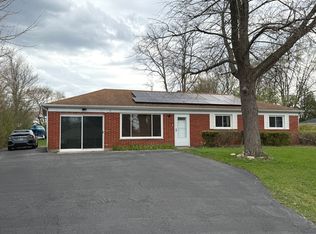
22W433 Arbor Ln, Glen Ellyn, IL 60137
Off Market
Zillow last checked:
Listing updated:
Steve Cooper 630-881-3657,
Cooper Real Estate Services Inc.
Not available
Estimated sales range
Not available
Not available
| Date | Event | Price |
|---|---|---|
| 5/6/2026 | Price change | $469,000-0.2%$391/sqft |
Source: | ||
| 4/17/2026 | Listed for sale | $470,000+49.2%$392/sqft |
Source: | ||
| 10/21/2021 | Sold | $315,000+28.6%$263/sqft |
Source: | ||
| 1/12/2018 | Sold | $245,000+2.1%$204/sqft |
Source: | ||
| 12/16/2017 | Pending sale | $240,000$200/sqft |
Source: Berkshire Hathaway HomeServices KoenigRubloff Realty Group #09815328 Report a problem | ||
| 12/10/2017 | Listed for sale | $240,000-2%$200/sqft |
Source: Berkshire Hathaway HomeServices KoenigRubloff #09815328 Report a problem | ||
| 5/16/2006 | Sold | $245,000+35%$204/sqft |
Source: Public Record Report a problem | ||
| 11/4/2002 | Sold | $181,500+16.3%$151/sqft |
Source: Public Record Report a problem | ||
| 4/19/2000 | Sold | $156,000$130/sqft |
Source: Public Record Report a problem | ||
| Year | Property taxes | Tax assessment |
|---|---|---|
| 2024 | $6,693 +5.3% | $102,045 +8.6% |
| 2023 | $6,356 +12.7% | $93,930 +13.5% |
| 2022 | $5,639 +2.6% | $82,770 +2.4% |
| 2021 | $5,497 -0.6% | $80,810 +0.9% |
| 2020 | $5,529 +3.1% | $80,060 +2.7% |
| 2019 | $5,364 +43.3% | $77,950 +40.1% |
| 2018 | $3,744 +8.8% | $55,640 +3.8% |
| 2017 | $3,442 +2% | $53,590 +4.2% |
| 2016 | $3,374 +1.3% | $51,450 +4.8% |
| 2015 | $3,330 -33% | $49,080 -29.2% |
| 2014 | $4,969 +3.4% | $69,300 -0.3% |
| 2013 | $4,805 +2.9% | $69,510 -4.1% |
| 2012 | $4,668 +3.2% | $72,480 -6.4% |
| 2011 | $4,521 +3.2% | $77,407 -5% |
| 2010 | $4,380 +4.2% | $81,480 -3.7% |
| 2009 | $4,203 +0.8% | $84,650 |
| 2008 | $4,169 +3.9% | $84,650 +4.8% |
| 2007 | $4,014 +10.3% | $80,770 +14% |
| 2006 | $3,638 +5.8% | $70,850 +7.1% |
| 2005 | $3,439 +4.2% | $66,150 +7.3% |
| 2004 | $3,300 +1.5% | $61,650 +8.4% |
| 2003 | $3,251 -0.2% | $56,880 +2.9% |
| 2002 | $3,258 +4.4% | $55,270 +7.5% |
| 2001 | $3,121 +2.9% | $51,420 +5.1% |
| 2000 | $3,034 | $48,920 |
Source: MRED as distributed by MLS GRID. This data may not be complete. We recommend contacting the local school district to confirm school assignments for this home.
A local agent can set up tours, give advice and negotiate with sellers.
A local lender can help you make sure your offer is ready when you are.