$1,763,000
4 bd|5 ba|6.3k sqft
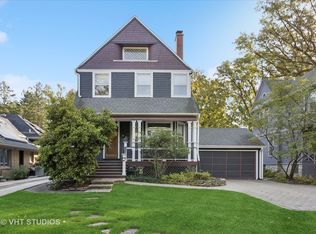
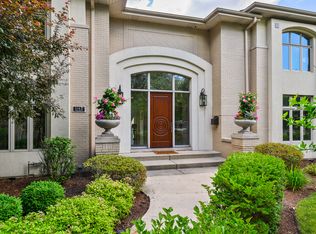
1142 Franklin Ave, River Forest, IL 60305
Off Market
Likely to sell faster than
Zillow last checked: 7 hours ago
Listing updated: February 27, 2026 at 12:45am
Stephen Scheuring 708-697-5900,
Baird & Warner
Not available
Estimated sales range
Not available
Not available
| Date | Event | Price |
|---|---|---|
| 2/25/2026 | Pending sale | $1,950,000$408/sqft |
Source: | ||
| 2/16/2026 | Contingent | $1,950,000$408/sqft |
Source: | ||
| 2/11/2026 | Listed for sale | $1,950,000+50%$408/sqft |
Source: | ||
| 10/1/2014 | Sold | $1,300,000-7.1%$272/sqft |
Source: | ||
| 8/3/2014 | Pending sale | $1,399,000$293/sqft |
Source: Berkshire Hathaway HomeServices KoenigRubloff Realty Group #08387461 Report a problem | ||
| 5/15/2014 | Price change | $1,399,000-3.5%$293/sqft |
Source: Berkshire Hathaway HomeServices KoenigRubloff Realty Group #08387461 Report a problem | ||
| 4/25/2014 | Price change | $1,450,000-3%$303/sqft |
Source: Berkshire Hathaway HomeServices KoenigRubloff Realty Group #08387461 Report a problem | ||
| 10/16/2013 | Price change | $1,495,000-3.7%$313/sqft |
Source: Prudential Rubloff #08387461 Report a problem | ||
| 7/9/2013 | Listed for sale | $1,553,000+721.7%$325/sqft |
Source: Prudential Rubloff #08387461 Report a problem | ||
| 6/14/2013 | Sold | $189,000$40/sqft |
Source: Agent Provided Report a problem | ||
| Year | Property taxes | Tax assessment |
|---|---|---|
| 2023 | $28,586 +29.2% | $107,736 +49.7% |
| 2022 | $22,129 +3.7% | $71,948 |
| 2021 | $21,339 +2% | $71,948 |
| 2020 | $20,920 -19.1% | $71,948 -17% |
| 2019 | $25,857 +5.6% | $86,720 |
| 2018 | $24,476 -27.7% | $86,720 -27.1% |
| 2017 | $33,840 +49.2% | $118,937 +62.9% |
| 2016 | $22,689 -6.4% | $73,026 -7.9% |
| 2015 | $24,241 +9.1% | $79,329 |
| 2014 | $22,221 +6.5% | $79,329 +3.6% |
| 2013 | $20,871 -1.8% | $76,600 |
| 2012 | $21,252 -15.7% | $76,600 -16.8% |
| 2011 | $25,225 -5.1% | $92,095 -16.8% |
| 2010 | $26,585 +1.6% | $110,642 |
| 2009 | $26,161 +4% | $110,642 -5% |
| 2008 | $25,160 +9.7% | $116,466 +15.7% |
| 2007 | $22,934 +6.4% | $100,684 |
| 2006 | $21,560 +4.8% | $100,684 |
| 2005 | $20,579 +14.1% | $100,684 +27.6% |
| 2004 | $18,038 +4.7% | $78,916 |
| 2003 | $17,224 -0.1% | $78,916 -4% |
| 2002 | $17,239 +14.7% | $82,212 +48.4% |
| 2001 | $15,030 +1% | $55,390 -13.4% |
| 2000 | $14,874 | $63,926 |
| 1999 | $14,874 | $63,926 |
Source: MRED as distributed by MLS GRID. This data may not be complete. We recommend contacting the local school district to confirm school assignments for this home.