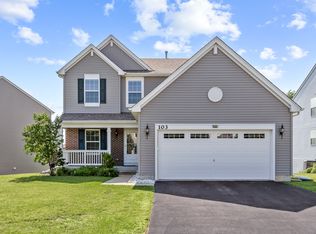
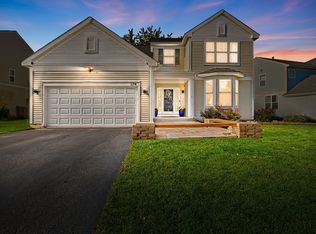
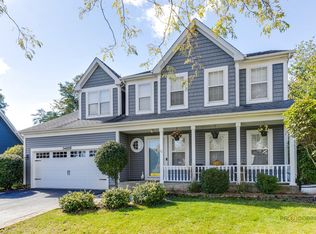
$502,800
4 bd3 ba3.2k sqft
1309 Wentworth Dr, Volo, IL 60020
Off Market

Listing description withheld by the listing agent.
Zillow last checked:
Listing updated:
Jay Turner 847-452-5518,
Under One Realty

Not available
Estimated sales range
Not available
Not available
| Date | Event | Price |
|---|---|---|
| 10/30/2026 | Listed for sale | $519,000$216/sqft |
Source:  MRED as distributed by MLS GRID #12793841 Report a problem | ||
| 10/27/2026 | Listing removed | -- |
Source: Owner Report a problem | ||
| 10/9/2026 | Listed for sale | $519,000+79%$216/sqft |
Source: Owner Report a problem | ||
| 5/14/2019 | Sold | $290,000-7.9%$121/sqft |
Source: MRED as distributed by MLS GRID #10308235 Report a problem | ||
| 3/25/2019 | Pending sale | $315,000$131/sqft |
Source: Berkshire Hathaway HomeServices KoenigRubloff Realty Group #10308235 Report a problem | ||
| 3/22/2019 | Price change | $315,000-3.1%$131/sqft |
Source: Berkshire Hathaway HomeServices KoenigRubloff Realty Group #10308235 Report a problem | ||
| 3/14/2019 | Listed for sale | $325,000+20.4%$135/sqft |
Source: Berkshire Hathaway HomeServices KoenigRubloff #10308235 Report a problem | ||
| 8/15/2012 | Listing removed | $1,650$1/sqft |
Source: TARABEIN INC. D/BA RE/MAX AT HOME #08126574 Report a problem | ||
| 7/31/2012 | Listed for rent | $1,650$1/sqft |
Source: TARABEIN INC. D/BA RE/MAX AT HOME #08126574 Report a problem | ||
| 8/27/2009 | Listing removed | $270,000$113/sqft |
Source: RE/MAX Showcase #07246079 Report a problem | ||
| 8/2/2009 | Price change | $270,000-5.3%$113/sqft |
Source: RE/MAX Showcase #07246079 Report a problem | ||
| 6/20/2009 | Listed for sale | $285,000-9.7%$119/sqft |
Source: RE/MAX Showcase #07246079 Report a problem | ||
| 12/20/2006 | Sold | $315,500$131/sqft |
Source: Public Record Report a problem | ||
| Year | Property taxes | Tax assessment |
|---|---|---|
| 2024 | $9,627 -1.1% | $106,081 +8% |
| 2023 | $9,737 -7% | $98,242 +6.2% |
| 2022 | $10,467 0% | $92,550 +4.5% |
| 2021 | $10,468 -0.7% | $88,566 +7.6% |
| 2020 | $10,537 +2.8% | $82,289 +4.3% |
| 2019 | $10,254 +20.7% | $78,911 +24.7% |
| 2018 | $8,498 | $63,266 +8.2% |
| 2017 | $8,498 +39.8% | $58,477 +9.3% |
| 2016 | $6,077 -16.2% | $53,481 +7.2% |
| 2015 | $7,248 -10.3% | $49,908 -17.1% |
| 2014 | $8,080 +6.1% | $60,212 -16.1% |
| 2012 | $7,614 -6.8% | $71,798 -16% |
| 2011 | $8,165 +0.3% | $85,455 -10.4% |
| 2010 | $8,144 -0.2% | $95,335 -11.9% |
| 2009 | $8,164 +1.7% | $108,184 +0.1% |
| 2008 | $8,028 +8654.8% | $108,022 +9.5% |
| 2006 | $92 | $98,623 |
Source: MRED as distributed by MLS GRID. This data may not be complete. We recommend contacting the local school district to confirm school assignments for this home.

A local agent can set up tours, give advice and negotiate with sellers.