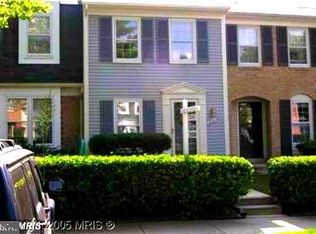
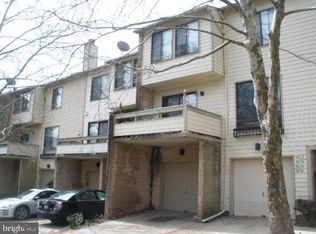
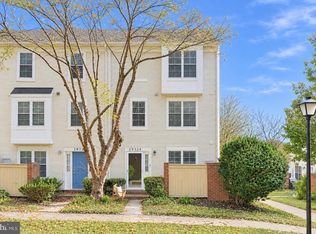
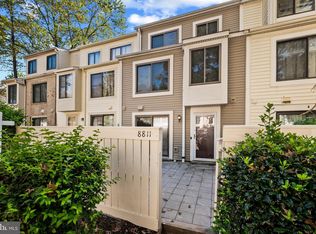
$355,400
3 bd3 ba1.4k sqft
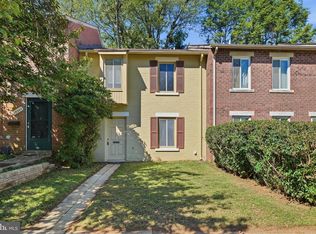
19310 Thomas Farm Rd, Gaithersburg, MD 20886
Off Market
Likely to sell faster than
Zillow last checked:
Listing updated:
Bryan Arias 240-855-3648,
Samson Properties 2406308689

$289,900
$275,000 - $304,000
$2,359/mo
| Date | Event | Price |
|---|---|---|
| 3/7/2012 | Sold | $168,000+8.4%$127/sqft |
Source: Public Record Report a problem | ||
| 11/3/2011 | Listing removed | $155,000$117/sqft |
Source: Fairfax Realty,Inc. #MC7499876 Report a problem | ||
| 10/19/2011 | Price change | $155,000-11.4%$117/sqft |
Source: Fairfax Realty,Inc. #MC7499876 Report a problem | ||
| 10/1/2011 | Listed for sale | $175,000+34.6%$133/sqft |
Source: Fairfax Realty,Inc. #MC7499876 Report a problem | ||
| 8/3/2011 | Listing removed | $129,999$98/sqft |
Source: Fairfax Realty,Inc. #MC7499876 Report a problem | ||
| 7/19/2011 | Price change | $129,999-13.3%$98/sqft |
Source: Fairfax Realty,Inc. #MC7499876 Report a problem | ||
| 7/8/2011 | Listed for sale | $149,999+15.4%$114/sqft |
Source: Fairfax Realty,Inc. #MC7499876 Report a problem | ||
| 4/22/2011 | Listing removed | $129,999$98/sqft |
Source: Fairfax Realty,Inc. #MC7499876 Report a problem | ||
| 3/31/2011 | Listed for sale | $129,999$98/sqft |
Source: Fairfax Realty,Inc. #MC7499876 Report a problem | ||
| 2/6/2011 | Listing removed | $129,999$98/sqft |
Source: Fairfax Realty,Inc. #MC7499876 Report a problem | ||
| 12/23/2010 | Listed for sale | $129,999-29.7%$98/sqft |
Source: Fairfax Realty,Inc. #MC7499876 Report a problem | ||
| 5/28/2004 | Sold | $185,000+41.2%$140/sqft |
Source: Public Record Report a problem | ||
| 8/12/2002 | Sold | $131,000+45.6%$99/sqft |
Source: Public Record Report a problem | ||
| 11/4/1994 | Sold | $89,950$68/sqft |
Source: Public Record Report a problem | ||
| Year | Property taxes | Tax assessment |
|---|---|---|
| 2026 | $3,913 +33.3% | $299,700 +8.1% |
| 2025 | $2,935 +0.1% | $277,167 +8.8% |
| 2024 | $2,931 +9.6% | $254,633 +9.7% |
| 2023 | $2,674 +7.1% | $232,100 +2.5% |
| 2022 | $2,498 +2.7% | $226,367 +2.6% |
| 2021 | $2,432 +2.6% | $220,633 +2.7% |
| 2020 | $2,371 +3.1% | $214,900 |
| 2019 | $2,301 -0.2% | $214,900 +3% |
| 2018 | $2,305 -2.8% | $208,633 +1.5% |
| 2017 | $2,372 +54.2% | $205,500 +9.1% |
| 2016 | $1,538 | $188,367 +10% |
| 2015 | $1,538 | $171,233 +11.1% |
| 2014 | $1,538 | $154,100 |
| 2013 | -- | $154,100 |
| 2012 | -- | $154,100 -17.2% |
| 2011 | -- | $186,100 |
| 2010 | -- | $186,100 |
| 2009 | -- | $186,100 -32.5% |
| 2008 | -- | $275,840 +20.9% |
| 2007 | -- | $228,246 +26.3% |
| 2006 | -- | $180,653 +35.8% |
| 2005 | -- | $133,060 +14.8% |
| 2004 | -- | $115,890 |
| 2003 | -- | $115,890 +42.1% |
| 2002 | -- | $81,550 |
| 2001 | -- | $81,550 |
Source: Bright MLS. This data may not be complete. We recommend contacting the local school district to confirm school assignments for this home.
A local agent can set up tours, give advice and negotiate with sellers.