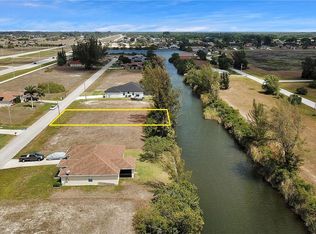
This beautiful, waterfront lot with access to 10,000 Islands, located at Everglades City is a Fisherman's dream! Beautiful neighborhood located Midway between Miami and Naples! Build and customize your dream home and make Florida's best kept secret your own!
Accepting backups
$35,000
78 Otter Avenue, Everglades City, FL 34139
--beds
--baths
6,098Square Feet
Unimproved Land
Built in ----
6,098 Square Feet Lot
$-- Zestimate®
$--/sqft
$-- HOA
What's special
- 841 days
- 9
- 0
Zillow last checked:
Listing updated:
Listed by:
Christopher T Nolan 772-266-5359,
EXP Realty LLC
Source: BeachesMLS,MLS#: F10454064 Originating MLS: BeachesMLS
Facts & features
Interior
Video & virtual tour
Property
Features
- On waterfront: Yes
- Waterfront features: Canal Front, Other
- Frontage type: Waterfront
- Frontage length: 61.00,61.00
Lot
- Size: 6,098 Square Feet
- Dimensions: 6098
- Residential vegetation: Heavily Wooded, Other
Details
- Additional structures: None
- Parcel number: 01212160009
Community & HOA
Community
- Subdivision: Acreage Header
HOA
- Has HOA: No
Location
- Region: Everglades City
Financial & listing details
- Tax assessed value: $36,808
- Annual tax amount: $546
- Date on market: 8/2/2024
- Cumulative days on market: 581 days
- Listing terms: Cash
Estimated market value
Not available
Estimated sales range
Not available
Not available
Price history
| Date | Event | Price |
|---|---|---|
| 9/18/2026 | Pending sale | $35,000 |
Source:  Florida Gulf Coast MLS #2026032845 Report a problem | ||
| 9/11/2026 | Contingent | $35,000 |
Source: eXp Realty #F10454064 Report a problem | ||
| 8/3/2026 | Listed for sale | $35,000 |
Source: eXp Realty #2026032845 Report a problem | ||
| 8/2/2026 | Listing removed | $35,000 |
Source: eXp Realty #224063884 Report a problem | ||
| 5/29/2026 | Listed for sale | $35,000 |
Source:  SWFLMLS #224063884 Report a problem | ||
| 3/7/2026 | Pending sale | $35,000 |
Source: eXp Realty #U8252252 Report a problem | ||
| 2/6/2026 | Listed for sale | $35,000-12.5% |
Source: SWFLMLS #224063884 Report a problem | ||
| 7/17/2025 | Listed for sale | $40,000-11.1% |
Source: SWFLMLS #224063884 Report a problem | ||
| 11/25/2024 | Price change | $45,000-10% |
Source:  BeachesMLS #F10454064 Report a problem | ||
| 9/6/2024 | Price change | $50,000-33.3% |
Source: BeachesMLS #F10454064 Report a problem | ||
| 8/2/2024 | Listed for sale | $75,000+158.6% |
Source: BeachesMLS #F10454064 Report a problem | ||
| 3/16/2023 | Listing removed | -- |
Source:  My State MLS Report a problem | ||
| 3/21/2022 | Listed for sale | $29,000+1218.2% |
Source: My State MLS #11062613 Report a problem | ||
| 5/21/1996 | Sold | $2,200 |
Source: Public Record Report a problem | ||
Public tax history
| Year | Property taxes | Tax assessment |
|---|---|---|
| 2025 | $369 -33.9% | $26,148 +10% |
| 2024 | $558 +2.3% | $23,771 +10% |
| 2023 | $546 +26.1% | $21,610 +10% |
| 2022 | $433 +31.5% | $19,645 +10% |
| 2021 | $329 +4.4% | $17,859 +10% |
| 2020 | $315 +3.4% | $16,235 +10% |
| 2019 | $305 +40% | $14,759 +10% |
| 2018 | $218 | $13,417 +10% |
| 2017 | $218 -6.5% | $12,197 +10% |
| 2016 | $233 +38.9% | $11,088 +10% |
| 2015 | $168 +14.2% | $10,080 |
| 2014 | $147 +1.7% | $10,080 |
| 2013 | $144 +3.6% | $10,080 +7.7% |
| 2012 | $139 +13.6% | $9,355 +10% |
| 2011 | $123 -72.4% | $8,505 -28.9% |
| 2010 | $445 +0.8% | $11,970 -61.6% |
| 2009 | $442 | $31,185 -4.8% |
| 2008 | $442 -73.7% | $32,760 -68.8% |
| 2007 | $1,679 +417% | $104,832 -7.1% |
| 2006 | $325 | $112,896 +443% |
| 2005 | $325 +64% | $20,790 +65% |
| 2004 | $198 -18.2% | $12,600 -16.7% |
| 2003 | $242 +13.1% | $15,120 +14.3% |
| 2002 | $214 -48.3% | $13,230 +5% |
| 2001 | $414 | $12,600 |
Find assessor info on the county website
Monthly payment
Climate risks
Neighborhood: 34139

Similar homes
- $20,0005,662 sqft0 HARLEM, Tallahassee, FL 32304Lot/Land
 MLS ID #2174199, JEREMY TORRES. realMLS
- $20,0005,662 sqft1325 ALABAMA Street, Tallahassee, FL 32304Lot/Land
 MLS ID #2174197, JEREMY TORRES. realMLS
- $49,0003.27 acresHardaway Hwy, Gretna, FL 32332Lot/Land
 MLS ID #407296, Lynn F Cox, Xcellence. TBR
- $28,0000.46 acresCactus St, Tallahassee, FL 32304Lot/Land
 MLS ID #391585, Shelley Poppell, Clover Key Realty. TBR
