Are Rent Prices Going Down?
The best time of the year to rent could be around the corner. Here’s why.


Written by Grant Brissey on August 25, 2026
Reviewed by Kara Ng, Edited by Jessica Rapp
Summer is usually the most competitive time of year for renters. As the moving season winds down, demand typically eases, and rents often follow. Asking rents usually peak in August or September. Meanwhile, December is usually the peak month for rental concessions, with January and February close behind.
If you’re starting your search in the next few months, you can likely expect less competition, better deals, and more concessions. But this also applies if you’re about to renew. Asking for concessions before you sign can bear more fruit in the fall and winter.
July data shows rents are still gaining ground nationally, even as deals remain common and conditions vary widely by metro.
Are rent prices going down?
Not yet nationally, but that seasonal relief is likely ahead in many markets. The typical U.S. rent reached $1,962 in July, up 0.3% from June and 2.3% from a year earlier. That works out to about $44 more a month for a similar rental than a year ago.
Renter tip: Those are national numbers. Zillow’s Rent Affordability Calculator can tell you what rentals actually fit your budget.
But July is typically near the end of the hot rental season. Rents commonly decline from September to October as renter demand cools, so shoppers who can wait may find less competition and more room to negotiate this fall.
That doesn’t mean every renter should expect a lower asking rent. In July, rent growth remained fastest in a handful of supply-constrained metros, particularly in California and the Northeast. Elsewhere, like Denver, Charlotte, and parts of Texas, large pipelines of newly built apartments are still giving renters more choices.
"Renters in those markets have benefited from one of the most favorable supply surges in decades," says Zillow Chief Economist Mischa Fisher. "Nationally, rents are still rising — but the calendar is about to work in renters' favor. Competition eases once the summer moving season ends, and renters who can time their search for the fall will likely find landlords more willing to make a deal."
Rent specials can lower the real cost of moving
Even where asking rents are rising, landlords are still competing for tenants. Nearly 2 in 5 Zillow rental listings (39.8%) offered a concession in July, like free rent, waived fees, or a reduced deposit. That’s up from 36% a year earlier.
For renters, that means the number on the listing may not be the full story. Ask about move-in specials, parking, application fees, and renewal terms before signing. Concessions often become more widespread as the market slows into fall and winter.
How are rent prices trending nationally?
July’s 2.3% annual growth is moderate by recent standards, but it marks a continued rise after a long stretch of cooling. The typical renter household in July spent 26.8% of its income on a new lease, essentially unchanged from the previous month and slightly less than a year ago. A household needs about $78,488 in annual income to comfortably afford the typical rental.
A key reason growth remains relatively contained: the apartment construction boom. More rental supply has kept pressure on landlords to price competitively and offer incentives. But supply is not evenly distributed, which is why conditions can feel very different from one metro to the next.
Where are rent prices dropping the most?
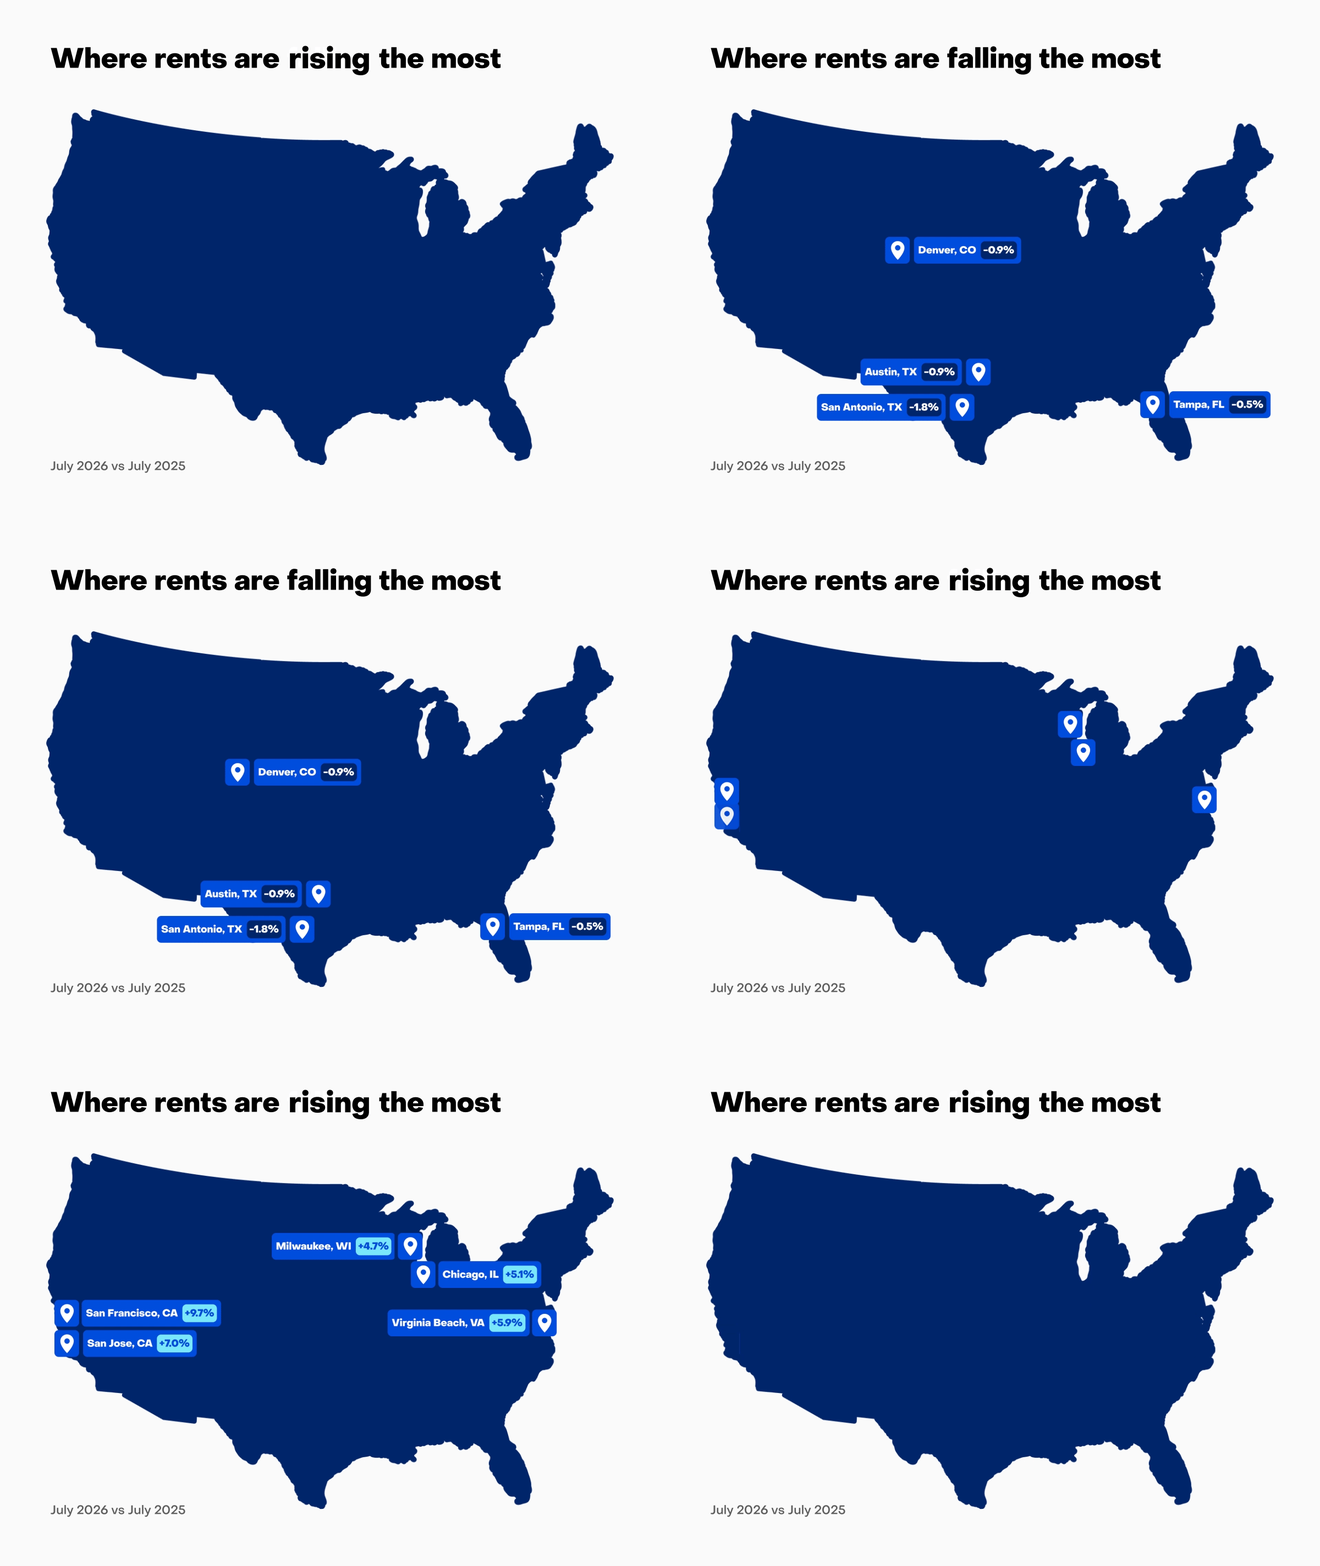
Year-over-year rent declines remain concentrated in markets with ample supply. These are the large metros where the typical rent was lower in July than it was a year earlier:
- San Antonio, TX: down 1.8%
- Austin, TX: down 0.9%
- Denver, CO: down 0.9%
- Tampa, FL: down 0.5%
These markets also tend to offer plentiful concessions, giving renters more time to compare options, negotiate a renewal or ask a landlord to match new-tenant pricing.
Where are rent prices rising?
Some markets are heading into fall with much less slack. In July, the largest year-over-year rent increases were in these metros:
- San Francisco, CA: up 9.7%
- San Jose, CA: up 7.0%
- Virginia Beach, VA: up 5.9%
- Chicago, IL: up 5.1%
- Milwaukee, WI: up 4.7%
- New York, NY: up 4.5%
- Cleveland, OH: up 4.3%
- St. Louis, MO: up 4.3%
- Kansas City, MO: up 3.7%
- Providence, RI: up 3.6%
In these tighter markets, come prepared with your credit information, references, and flexibility on lease length or move-in date. Waiting until fall can still reduce competition, but it may not translate into a lower rent everywhere.
Renter tip: The renter who applies first often wins the unit. A Zillow rental application packages your background and credit report into one submission you can reuse across participating listings, all for $35.
July rent growth rankings: 50 largest metros
Year-over-year growth in the typical rent, ranked from lowest to highest.
| Rank | Metro area | Year-over-year rent growth |
| 1 | San Antonio, TX | −1.8% |
| 2 | Austin, TX | −0.9% |
| 3 | Denver, CO | −0.9% |
| 4 | Tampa, FL | −0.5% |
| 5 | Houston, TX | 0% |
| 6 | Dallas, TX | +0.1% |
| 7 | Las Vegas, NV | +0.2% |
| 8 | Phoenix, AZ | +0.3% |
| 9 | Portland, OR | +0.3% |
| 10 | Washington, DC | +0.4% |
| 11 | Salt Lake City, UT | +0.5% |
| 12 | Raleigh, NC | +0.5% |
| 13 | Nashville, TN | +0.6% |
| 14 | Charlotte, NC | +0.6% |
| 15 | Orlando, FL | +0.6% |
| 16 | Memphis, TN | +1.2% |
| 17 | New Orleans, LA | +1.2% |
| 18 | Birmingham, AL | +1.4% |
| 19 | Miami, FL | +1.4% |
| 20 | Seattle, WA | +1.4% |
| 21 | Jacksonville, FL | +1.4% |
| 22 | Los Angeles, CA | +1.5% |
| 23 | Sacramento, CA | +1.7% |
| 24 | San Diego, CA | +1.8% |
| 25 | Louisville, KY | +1.8% |
| 26 | Columbus, OH | +1.9% |
| 27 | Atlanta, GA | +2.1% |
| 28 | Oklahoma City, OK | +2.4% |
| 29 | Riverside, CA | +2.5% |
| 30 | Baltimore, MD | +2.5% |
| 31 | Boston, MA | +2.6% |
| 32 | Indianapolis, IN | +2.7% |
| 33 | Cincinnati, OH | +2.7% |
| 34 | Richmond, VA | +2.7% |
| 35 | Hartford, CT | +2.8% |
| 36 | Buffalo, NY | +3.3% |
| 37 | Pittsburgh, PA | +3.4% |
| 38 | Philadelphia, PA | +3.4% |
| 39 | Minneapolis, MN | +3.5% |
| 40 | Detroit, MI | +3.6% |
| 41 | Providence, RI | +3.6% |
| 42 | Kansas City, MO | +3.7% |
| 43 | St. Louis, MO | +4.3% |
| 44 | Cleveland, OH | +4.3% |
| 45 | New York, NY | +4.5% |
| 46 | Milwaukee, WI | +4.7% |
| 47 | Chicago, IL | +5.1% |
| 48 | Virginia Beach, VA | +5.9% |
| 49 | San Jose, CA | +7.0% |
| 50 | San Francisco, CA | +9.7% |
Find an apartment you’ll love on Zillow
With Zillions of up-to-date listings and filters for your must-haves, it's easy to find your perfect apartment on Zillow Rentals.
Search rentalsRelated Articles

Stay on track with Renter Hub
Save your favorite rentals, message landlords, track your application status, create a free renter profile and more - all in your Renter Hub
Visit your hub