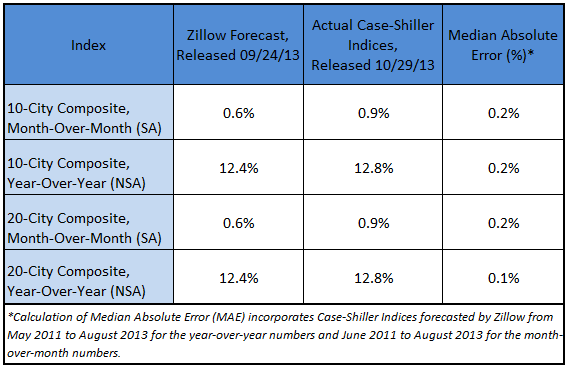
Today, the S&P/Case-Shiller Home Price Indices showed that the non-seasonally adjusted (NSA) August 10- and 20-City Composites each rose 12.8 percent, respectively, on a year-over-year basis, in line with Zillow’s forecast released last month. On a seasonally adjusted (SA) monthly basis, the 10- and 20-City Composites rose 0.9 percent, respectively, from July to August. The table below shows how Zillow’s forecast compared with the actual numbers.
“The summer-long slowdown in monthly home value appreciation we’ve been observing for months is finally beginning to be reflected even in older Case-Shiller data. This is a welcome sign overall, especially in some of the larger, coastal metros — particularly on the West Coast — that dominate the Case-Shiller indices,” said Zillow Chief Economist Dr. Stan Humphries. “Several hot markets that were already expensive to begin with were getting too far out over their skis, as rapid home value appreciation and rising mortgage interest rates outpaced income growth and risked causing these markets to become unaffordable. It’s good to see the pace of home value appreciation moderate, allowing the market to get back into a more sustainable balance and not topple over. Home value appreciation is better when it’s boring, and we expect to see continued moderation, even in the still-inflated year-over-year Case-Shiller numbers.”
Our forecasting model incorporates previous data points of the Case-Shiller series, as well as Zillow Home Value Index data and national foreclosure resales. To see our forecast for the September Case-Shiller indices, click here. To see how Zillow’s forecast of the July Case-Shiller indices compared, see our blog post from last month.
