In Search of Affordability

Across the United States, strong home price affordability has been recently eroded by a combination of rising home prices and mortgage rates. Some areas, particularly on the West Coast, have begun to look unaffordable compared to their historic norms, forcing some household to look to the periphery of urban areas in search of affordable homes.
At Zillow, we measure affordability by looking at how much of a person’s monthly income is spent on a mortgage payment. Historically in the United States, the median household would need to spend 22.1 percent of their income to afford the mortgage payments on the median home. This number fell dramatically during the housing recession, hitting a low of under 13 percent by the end of 2012.
Since then, both prices and interest rates have recovered, increasing the share of income needed to buy the median home to 15.1 (2013 Q4) percent nationwide – higher than in 2012, but still well below its historical average. This share of income is up from 15.0 percent reported in 2013 Q3 for the U.S. Looking forward, the U.S. is forecasted to remain more affordable than its historical average, as long as interest rates remain below 7 percent over the next year – an extremely likely scenario.
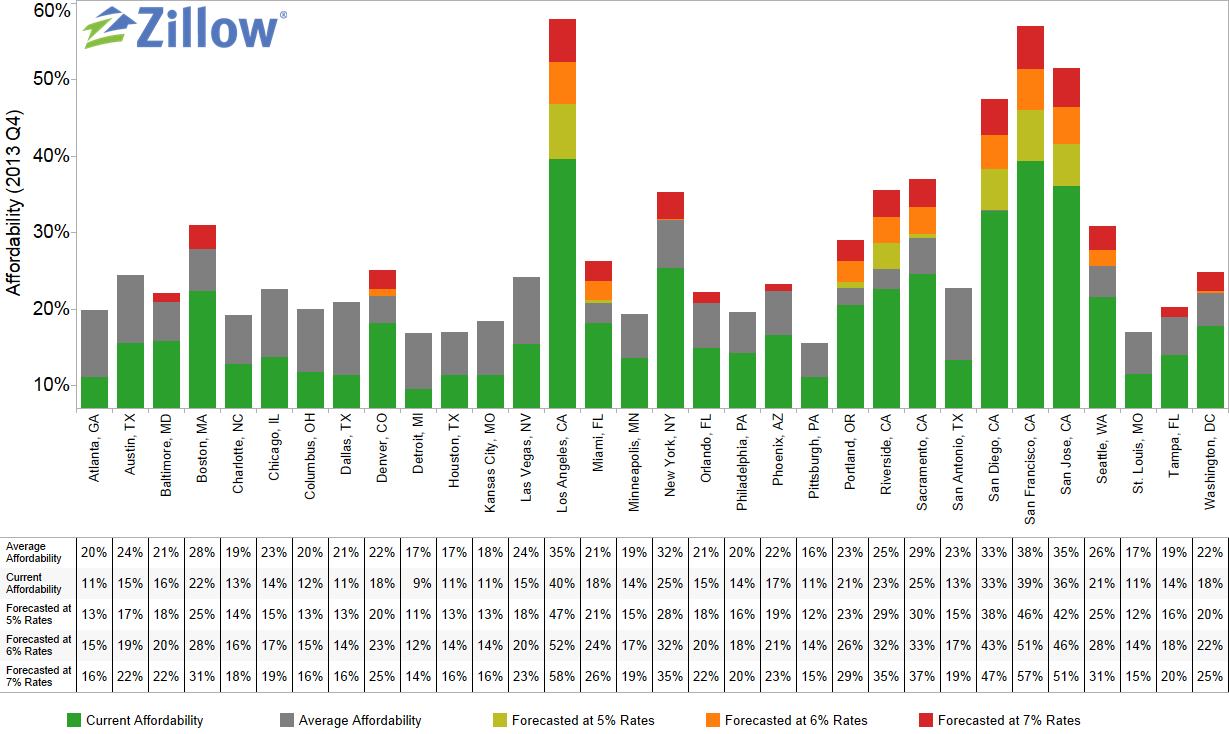
However, in several major West Coast cities, the extraordinary pace of local appreciation has already pushed the share of income needed to make mortgage payments on an average home above its historical average. In the San Francisco metropolitan area, for example, housing has always been expensive. Historically the median household in San Francisco would need to spend 37.7 percent of their income to afford the mortgage payments on the median home. But strong appreciation in the area has pushed that number to over 39 percent currently. Buyers in Los Angeles and San Jose also find themselves in a similar position of having to pay more of their monthly income to afford an average home than they are used to. For each of the top metros in the country, the following chart shows historical affordability, current affordability and forecasted affordability at mortgage rates of 5, 6 and 7 percent.
This falling affordability has resulted in greater pressure to move further away from urban job centers in order to find affordable housing options. Returning to San Francisco, the map below examines where these pockets of affordability in the Bay Area are located by looking at the fraction of homes that are affordable at a given mortgage payment.
For households making the median income and willing to spend the historic San Francisco average of 37.7 percent of that income on a mortgage, the areas in which more than half of current homes are affordable are clustered south of the city and across the bay in Oakland – away from the hubs of San Francisco and Silicon Valley.
To calculate an affordability index for a region, we first calculate the mortgage payment for the median house price in a metropolitan area by using the metro-level Zillow Home Value Index for a given quarter and the 30-year fixed mortgage rate during that time period, which is provided by the Freddie Mac Primary Mortgage Market Survey (based on a 20 percent down payment). Then we consider what portion of the monthly median household income goes toward this monthly mortgage payment. The affordability forecast is calculated similarly to the current affordability index but uses the one year Zillow Home Value Forecast instead of the Zillow Home Value Index and a specified interest rate in lieu of PMMS. It also assumes a 20 percent down payment.
The fraction of affordable homes in a zip code for a particular mortgage payment is calculated by first determining the largest possible mortgage (under the terms described above) that could be supported by that monthly payment. Affordable homes are those with a value less than this mortgage amount after accounting for a 20 percent down payment.
