Uncategorized
October Home Sales Forecast: Going Nowhere Fast
For the past two months, existing and new home sales have moved in opposite directions: When one has gone up, the other has gone down. We don’t expect this pattern to change when October home sales data is released next month.
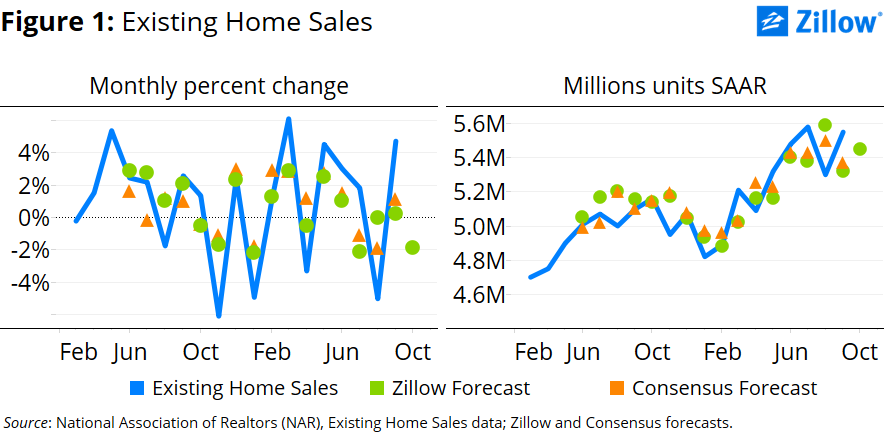
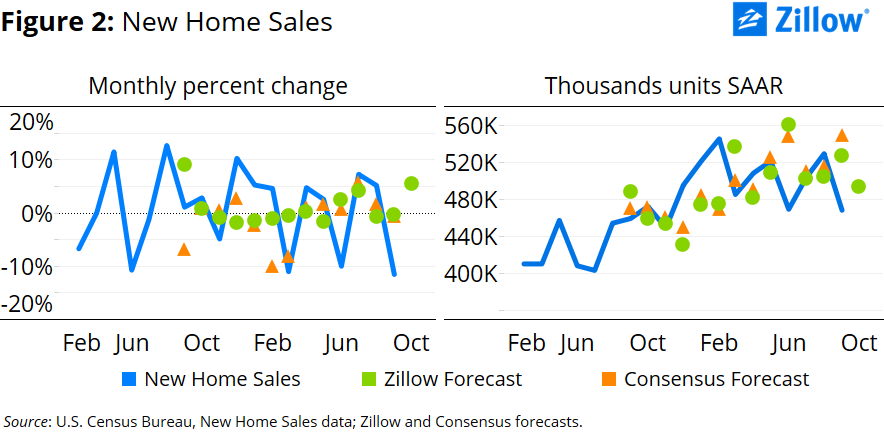
- Zillow expects existing home sales to fall 1.9 percent to 5.45 million units (SAAR) in October after a strong September. For new home sales, Zillow expects a 5.3 percent jump to 493,000 units (SAAR).
- The number of renter households has been growing at a near-record pace. In the near-term, home sales should continue to be driven by current homeowners both buying from and selling to other homeowners.
- There are now about 4.5 home sales (including both existing and new homes) for every 100 households, roughly in line with the historic average of 4.4 sales per 100 households that prevailed between 1985 and 1999.
For the past two months, existing and new home sales have moved in opposite directions: When one has gone up, the other has gone down. We don’t expect this pattern to change when October home sales data is released next month.
Our forecast for existing home sales suggest that after a strong September, existing home sales should retreat 1.9 percent to 5.45 million units at a seasonally adjusted annual rate (SAAR) (figure 1). And after a weak September, new home sales should advance 5.3 percent, to 493,000 units SAAR (figure 2). Plus ca change…
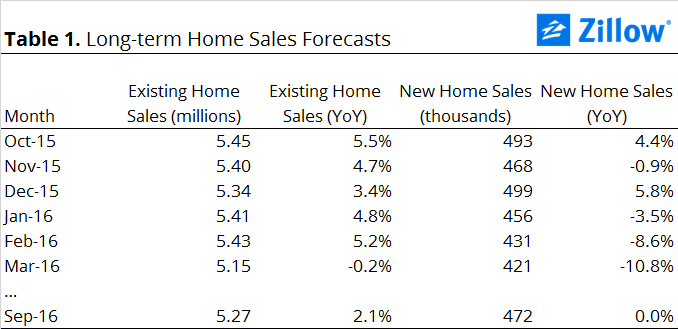
Over the next six months, we expect home sales to remain roughly within the range they’ve occupied throughout the late spring and into the summer and early fall (table 1).
Incoming data suggest we shouldn’t expect home sales to rise dramatically in the months ahead.
In July 2015, combined existing and new home sales surpassed the 6 million mark for the first time since May 2007. Since then, they have flitted back and forth across that threshold – falling below in August, rising back above in September and, by our estimates, likely falling below it again come October. Combined home sales stood at slightly more than 6 million during the late 1990s and early 2000s, just prior to the most dramatic phase of the mid-2000s housing boom.
There are now about 4.5 home sales (including both existing and new homes) for every 100 households.[1] This is well above the recent, summer 2010 low of three sales per 100 households, but also well below the peak of seven sales per 100 households observed in late summer 2005. It is also roughly in line with the historic average of 4.4 sales per 100 households that prevailed between 1985 and 1999 – a period of generally stable housing markets nationwide.
There were about 2.3 million homes for sale (SAAR) at the end of September when combining existing homes for sale at the end of the month and new, unsold homes. This translates into 2 homes for sale for every 100 households, or 5.5 homes for sale for every renter household. This is slightly below rates that prevailed in the late 1990s, when there were about 2.2 homes for sale for every 100 households and 6.7 homes for sale for every 100 renter households.
Mortgage rates remain historically low, but the five-year change in mortgage rates – which are closely related to housing turnover – is smaller than it is been for much of the recovery. As interest rates begin to rise, even modestly, homeowners will increasingly encounter mortgages with higher interest rates than they currently hold if they decide to move and sell their current home. In some marginal cases, this could sway their decision to list their home for sale, further dampening inventory. But the gap will likely be small, and most home sellers-turned-buyers will have other compelling personal reasons to move that could negate these effects.
But despite data pointing to little growth in sales, there are also clear tailwinds building.
Although sales per household are approaching their late 1990s levels, the homeownership rate is well below where it was in the late 1990s. And there are between 15 million and 20 million more renter households today than there were at that time. Growing at a rate in excess of 3 percent a year, renter households are increasing at a faster pace than has virtually ever been recorded. From Q3 2014 to Q3 2015, the United States created 1.3 million renter households to only 110,000 owner households. Sooner or later, these renter households will decide to buy.
For the moment, however, home sales are still being driven by owner-to-owner transitions; moving from renter-to-owner remains exceedingly difficult.
[1] Existing and new single-family sales divided by the number of households. We focus on single-family sales here since a longer history is available.
