August Market Reports: The Tide Is Rising, But Some Boats Are Sinking

It’s said that a rising tide lifts all boats. But the hyper-local reality of the real estate market means that in many communities nationwide, some boats are getting swamped, even as the tide rises around them.
Almost 30 percent of all homes nationwide (27.9 percent) lost value in August from a year earlier, all while median U.S. home values overall continued to rise steadily, up 3.3 percent year-over-year to a U.S. Zillow Home Value Index of $180,800.
Not all markets are experiencing the recovery evenly. As a result, some big metro markets had a relatively large share of homes lose value over the past year, while others had precious few.
Of the largest 35 metro markets covered by Zillow, Baltimore, Washington, D.C., and Philadelphia all had more than 40 percent of homes lose value year-over-year in August. On the other hand, Denver, Dallas-Fort Worth, San Francisco, San Jose, Seattle and Portland all had less than 10 percent of homes lose value over the past year. Denver, which continues to be the hottest large real estate market in the county, had a scant 1.5 percent of homes lose value over the past year.
And while conditions vary from market to market, they can also differ dramatically within markets, too. In the larger Baltimore metro, for example, 48.1 percent of homes are currently losing value. But only 24.8 percent of homes in ZIP code 21040 in the city of Edgewood to the northeast of the City of Baltimore are losing value. In ZIP code 21623 in the community of Church Hill, across the Chesapeake Bay from Baltimore, 74.1 percent of homes are losing value.
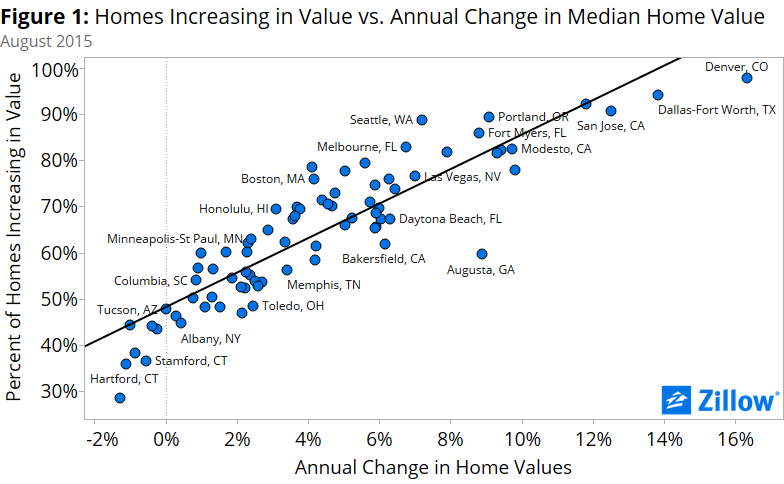 In the Denver area, less than 1 percent (.07 percent) of all homes in ZIP code 80017 in the city of Aurora lost value year-over-year in August, compared to 23 percent in ZIP code 80827 in the community of Lake George. There is a strong relationship between the pace of overall home value growth in the larger metro and the share of homes losing or gaining value (figure 1). But, as with most things in real estate, the relationship isn’t perfect and depends strongly on local dynamics and the separate merits of individual homes. Even in areas with the strongest overall home value appreciation, some homes are falling in value. Likewise, even in areas with very slow or even negative annual growth in home values, some lucky homeowners are still seeing the value of their properties increase.
This is still more proof that the larger housing market continues to transition away from uniform moves up and down largely in lockstep with broader national trends, and toward a more fragmented market in which local markets rise and fall based on local conditions.
In some markets, builders constructed huge amounts of homes during last decade’s run-up to the boom and bust, sometimes in areas farther from the city center that remain less desirable today and so attract fewer buyers. As a result, home values for these homes may fall. In other markets, like the Bay Area, demand is so high and the supply of homes so low, prices have been pushed up across the board, even for homes farther from the city center as workers seek housing within their budget. Buying and selling a home is really a matching game – buyers need to find a seller willing to part with their home at a given price, and sellers need to find buyers that are both seeking the kind of home they’re selling and willing to pay their price.
When that delicate balance is thrown out of whack in a given neighborhood, town, county or metro – too many buyers looking for a certain type of home, or too many sellers of certain homes – values on individual homes inevitably respond by rising or falling, sometimes out of line with values overall.
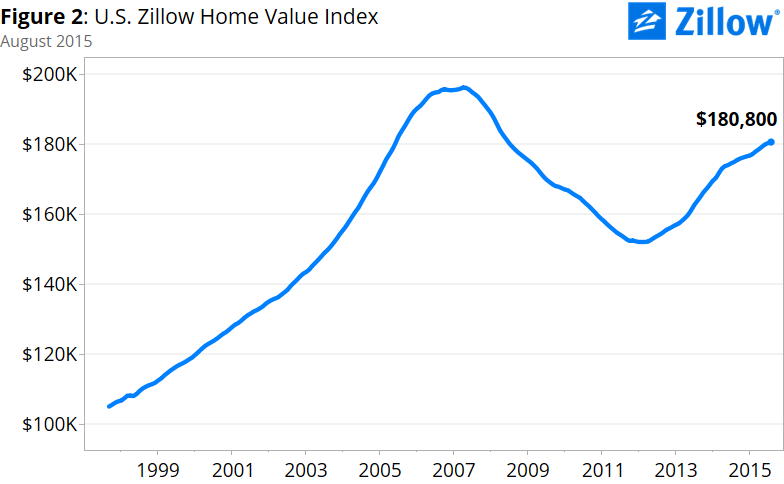 The August 2015 Zillow Real Estate Market Report covers 516 metropolitan and micropolitan areas. The median U.S. home value crossed $180,000 in August to end the month at $180,800, up 3.3 percent from August 2014 and up 0.2 percent from July 2015. Nationally, home values are 7.9 percent off their April 2007 peak value of $196,400 (figure 2).
For the past 6 months, home values have appreciated less than 4 percent on an annual basis, and have risen at less than a 3.5 percent annual pace for the past 5 months, indicating a continued flattening in annual appreciation in home values nationwide. In August 2014, home values were appreciating at twice the pace of August 2015.
In August, three markets saw monthly appreciation of one percent or greater: Denver (1.1 percent), San Francisco (1 percent) and Miami-Fort Lauderdale (1 percent). Denver and San Francisco saw double digit annual appreciation in home values, with Denver’s annual change in values topping 16 percent year-over-year. Three large markets saw slight home value declines in August from July: Washington, D.C. and Baltimore were both down 0.2 percent, while Cincinnati was down 0.1 percent over the past month. Home values were flat in Minneapolis from July to August. Annually, Baltimore and Washington both experienced overall declines in median home values. Of the 516 markets covered by Zillow, 383 saw monthly appreciation in home values and 430 saw annual appreciation.
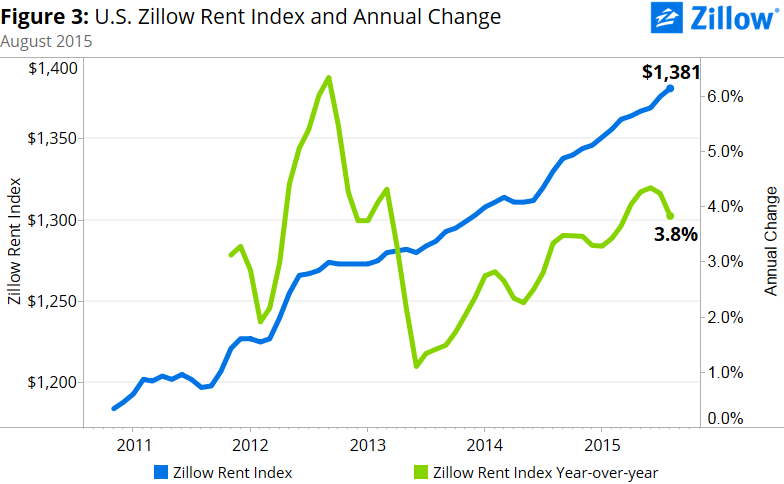 Nationwide, rents grew 3.8 percent year-over-year in August, and 0.4 percent from July, to $1,381 per month (figure 3), according to the Zillow Rent Index (ZRI). Rent growth continues to outpace home value growth nationally but only in twelve of the largest 35 markets.
All but two (Chicago and Pittsburgh) of the 35 largest markets covered by Zillow experienced annual rental growth in August. Among large markets, year-over-year rental growth was up by double-digits in San Francisco (13.3 percent), Denver (11.7 percent) and Portland, Oregon (up 10.8 percent). Rents rose year-over-year in 597 of the 862 metropolitan and micropolitan areas covered by the ZRI (69 percent).
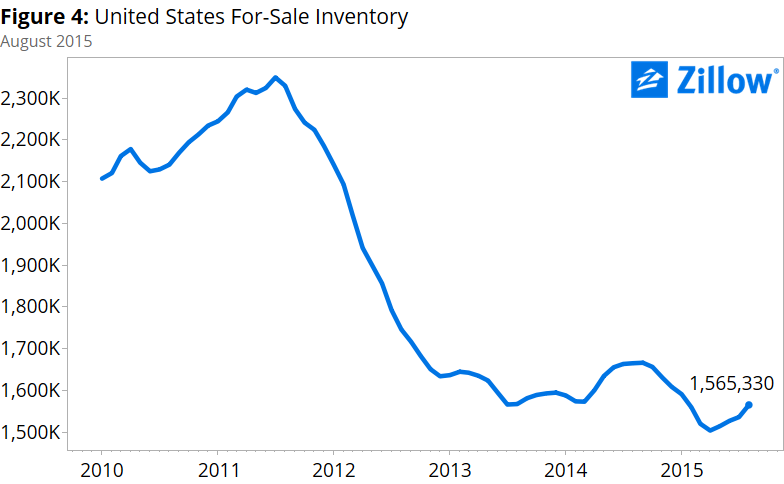 August marks the fourth month that for-sale inventory of homes has increased from the prior month (seasonally adjusted). Still, compared to the number of homes for sale in August 2013 and 2014, there are less homes listed for sale this year. For-sale inventory is down 6 percent year-over-year (figure 4).
Inventory fell year-over-year in 23 of the nation’s largest 35 metro markets. Charlotte, San Diego and San Antonio experienced the biggest declines in inventory, while Austin, Atlanta and Washington, D.C., had the biggest increases. Of the 743 markets covered by Zillow, 484 experienced annual declines in inventory.
Over the next year, the pace of home value growth is expected to continue to slow, growing 2.2 percent from August 2015 to August 2016, according to the Zillow Home Value Forecast. Over the past year, home values grew 3.3 percent. Of the largest metros covered by Zillow, median home values in Baltimore and Washington, D.C., are expected to fall over the coming year, while home values Dallas-Fort Worth (6 percent), Las Vegas (5.3 percent) and Seattle (5.1 percent) are expected to experience the fastest growth.
While the slowdowns may be worrisome to some on first glance, this is not a sign of the market shifting into reverse. Rather, some markets are merely pumping the brakes a bit as local conditions on the ground – the local job market, household formation and income growth chief among those – continue to exert more influence over local markets. It’s easy to say the recession is over when homes in a third of the biggest markets are more expensive now than ever before, but we’re still seeing a number of homes losing value. The reality is there are still areas lagging behind in the recovery, just as there are areas where growth is outpacing both their larger metro and the nation as a whole. All real estate is local, and August’s data only serves to reinforce that fact.
